TikTok Analytics Dashboard: How To Use It + Key Metrics
At AI Flow Chat
Contents
0%Posting on TikTok without checking your numbers is like running ads with your eyes closed. The TikTok analytics dashboard gives you a direct line into what's working, what's flopping, and where your next growth opportunity sits. But most creators and marketers either don't know it exists, barely scratch the surface, or get lost in metrics that don't actually move the needle.
Understanding your analytics is the first step. Acting on those insights at scale is where the real leverage kicks in. That's exactly why we built AI Flow Chat, a visual AI platform where you can feed TikTok videos directly into an AI canvas, extract what makes them perform, and turn those patterns into repeatable content workflows. Analytics tell you what happened; the right tools help you replicate why it happened.
This guide walks you through accessing TikTok's native analytics, breaks down every key metric worth tracking, and shows you how to turn raw data into a content strategy that compounds. Whether you're a solo creator or managing content for clients, you'll leave with a clear framework for reading and using your TikTok data, not just staring at it.
What the TikTok analytics dashboard shows and who gets it
The TikTok analytics dashboard is TikTok's built-in reporting tool that tracks how your account and individual videos perform over time. It pulls data on views, follower growth, engagement rates, and audience behavior, then surfaces all of it inside TikTok Studio in a structured interface you can access from desktop or mobile. You don't need a third-party subscription to see this data, but you do need to meet one basic account requirement before any numbers show up.
Who gets access to TikTok analytics
TikTok restricts analytics to Creator Accounts and Business Accounts only. Personal accounts don't display analytics by default, so if you're running content with any kind of strategy behind it, switching your account type is the first move to make. Once you switch, TikTok starts tracking data from that point forward, which means you won't recover performance history from before the change.
Both Creator and Business Accounts use the same core analytics interface. Business Accounts do unlock a handful of additional data points around profile visits and content reach, which makes them the stronger choice if you're managing brand content, running paid campaigns, or reporting to clients who need broader visibility into account performance.
What the dashboard actually covers
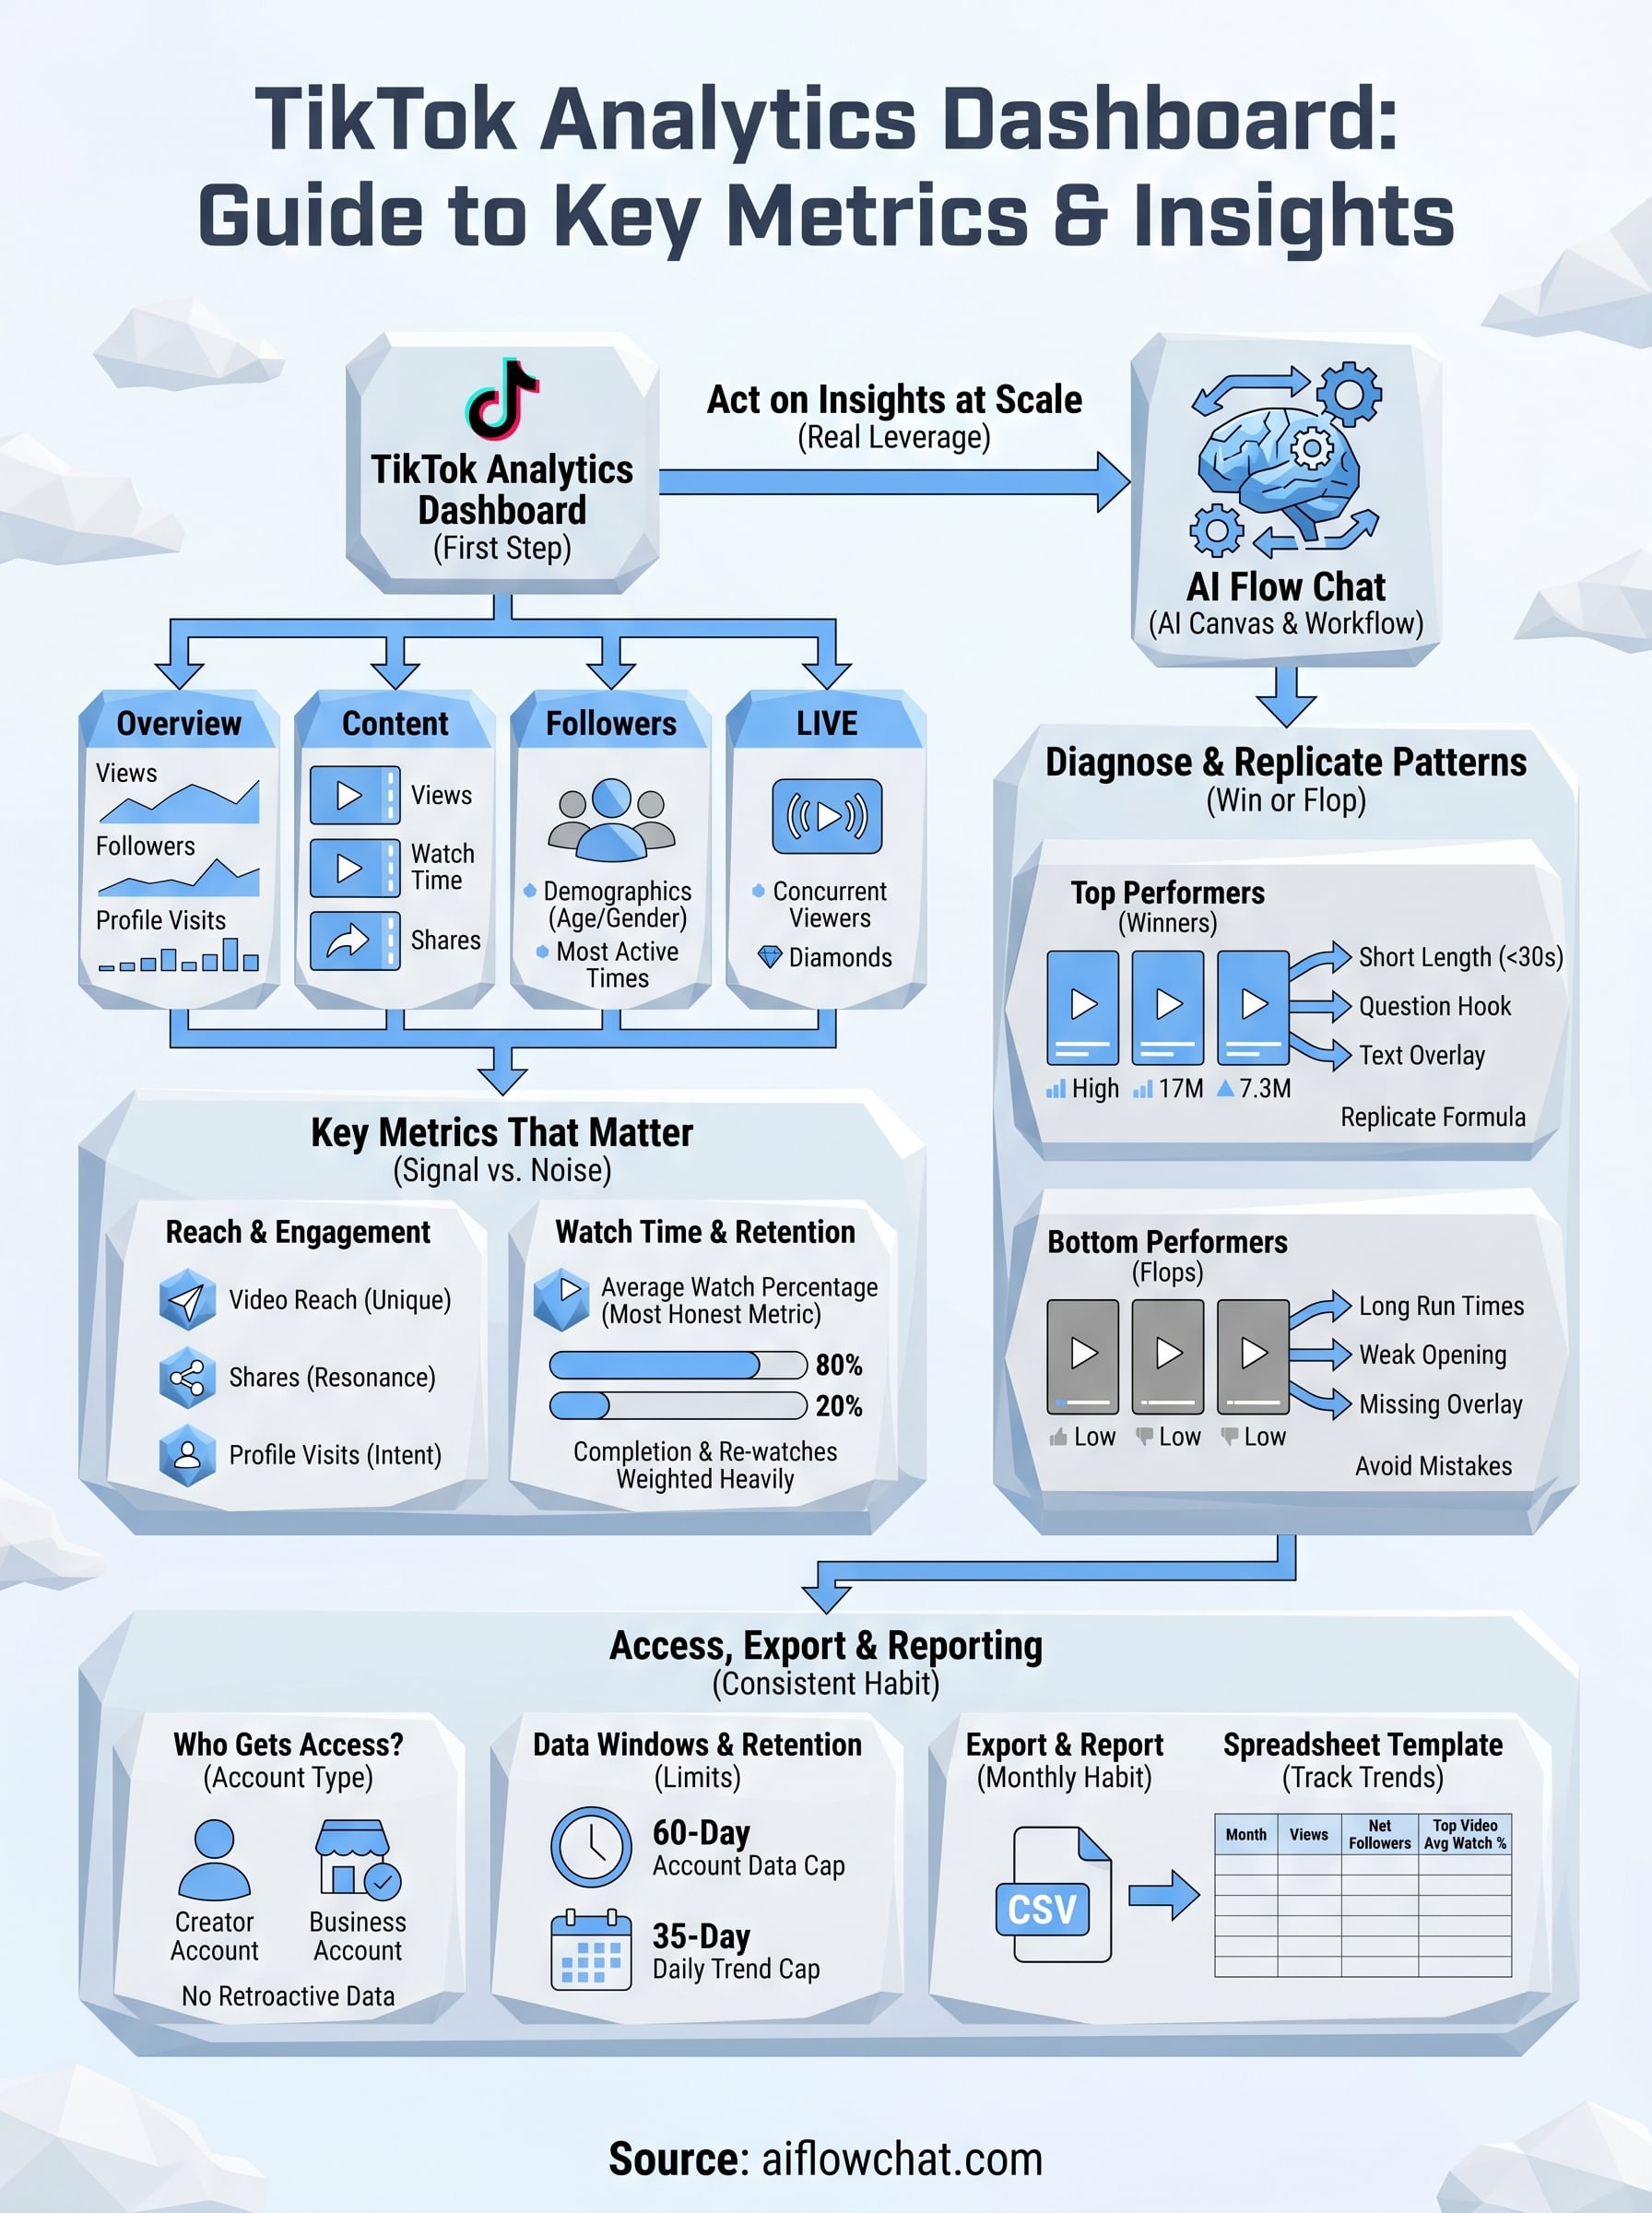
The dashboard splits your data into four main sections: Overview, Content, Followers, and LIVE. Overview gives you top-level account performance across a date range you select. Content breaks down individual video metrics so you can compare posts directly against each other. Followers shows you audience demographics including age, gender, top territories, and most active times on the platform. LIVE tracks stream performance separately if you go live regularly.
The most underused tab is Followers, specifically the "Most Active Times" chart, which tells you exactly when your audience is online and ready to engage.
Each section gives you a different lens on what's actually happening with your account. Content-level data is where most of your diagnostic work happens because it lets you isolate which videos drove real results versus which ones fell flat. Follower data helps you verify whether the audience you're building actually matches who you intended to reach in the first place.
Data windows and retention limits
TikTok's native dashboard lets you view account-level metrics going back up to 60 days. Individual video metrics are available for the lifetime of the post, but granular daily trend data caps out at 35 days for older content. If you need quarterly reporting or want to spot longer-term patterns in your growth, you'll need to export that data manually or pull it through a third-party connection, which this guide covers in a later step.
Consistent data tracking matters because TikTok doesn't preserve granular historical breakdowns past these windows. Miss the cutoff, and that data is permanently gone. Building a habit around regular exports or connecting an external reporting tool is the only reliable way to maintain a clean, long-range record of your account's performance.
Step 1. Turn on analytics and find the dashboard
Before any data shows up in your TikTok analytics dashboard, your account type needs to be correct. TikTok only surfaces analytics for Creator Accounts and Business Accounts, so if you're on a standard personal account, the analytics tab simply won't appear. This is a one-time switch that takes less than two minutes, and it immediately starts recording data going forward.
Switch your account to Creator or Business
Open your TikTok profile, tap the hamburger menu in the top right corner, and go to Settings and Privacy. From there, select "Account," then "Switch to Creator Account" or "Switch to Business Account." TikTok will walk you through a short setup to confirm your category. Once you confirm, analytics tracking begins immediately from that moment. There's no retroactive data for anything posted before the switch, so doing this early matters.
If you manage content for clients or run multiple accounts, switch every account to Business Account since it surfaces slightly more reach and profile visit data than Creator mode.
Choose Creator if you're a solo content producer focused on organic growth. Business Account works better for brand pages, agencies, and anyone running paid promotions alongside organic content because it integrates more cleanly with TikTok Ads Manager data.
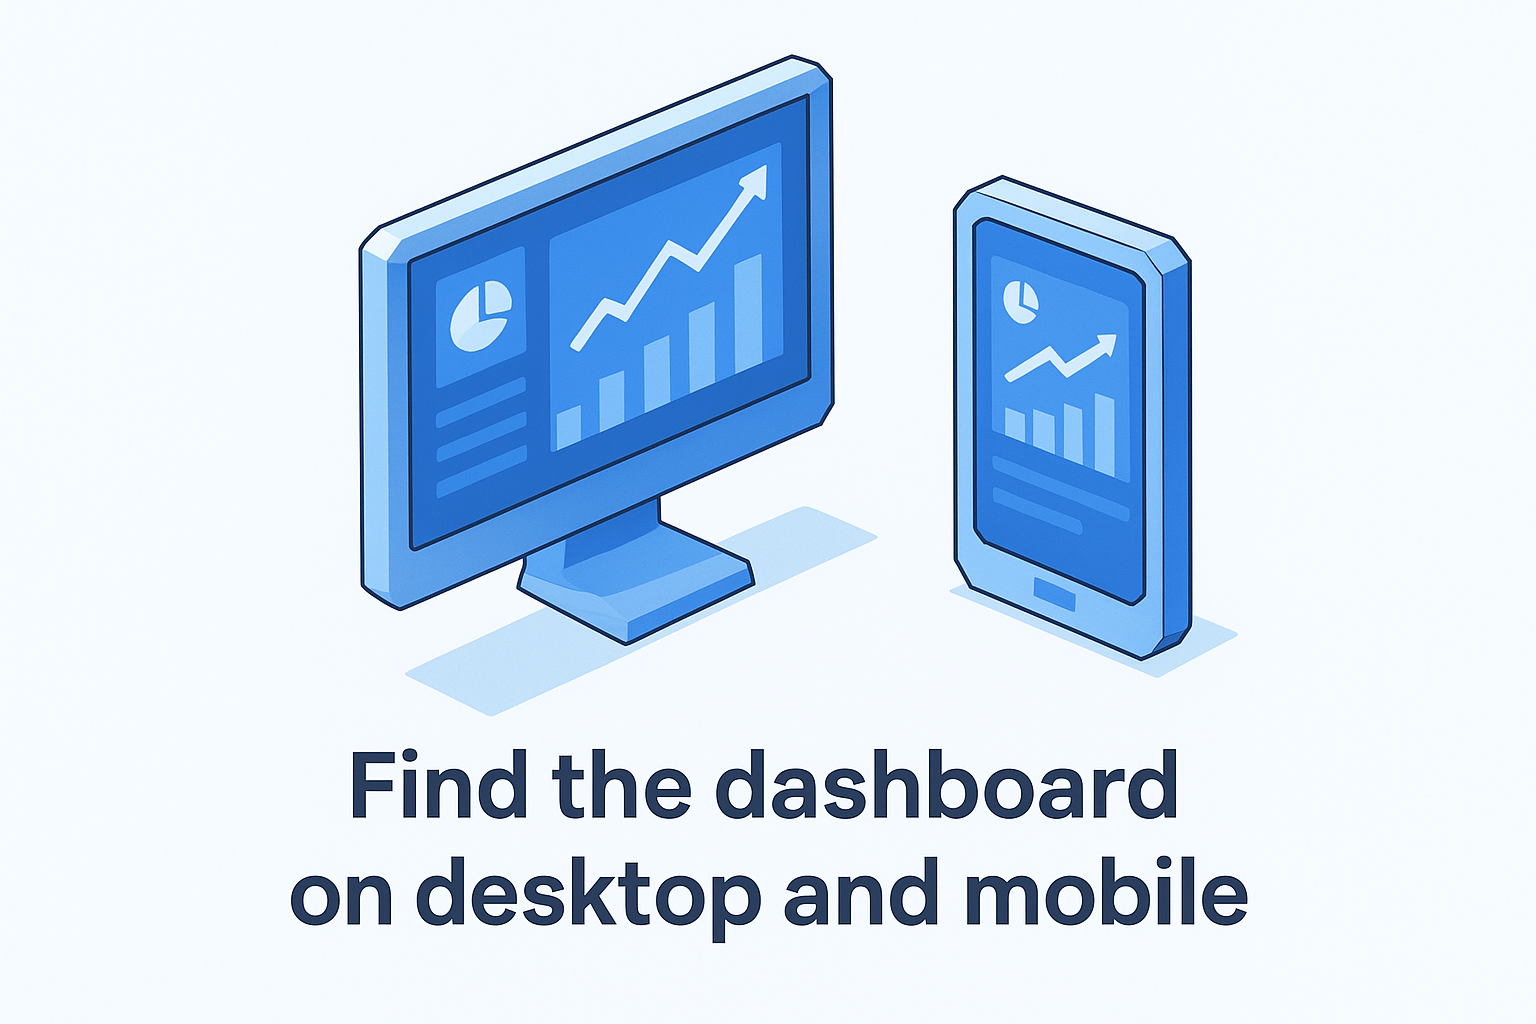
Find the dashboard on desktop and mobile
Accessing the dashboard differs slightly depending on your device. Use the table below to get there fast on each platform.
| Platform | Path to analytics |
|---|---|
| Desktop | Go to TikTok.com, click your profile icon, select TikTok Studio, then click "Analytics" in the left sidebar |
| Mobile (iOS/Android) | Tap your profile, open the hamburger menu, tap Creator Tools, then tap "Analytics" |
| TikTok Studio app | Open the app directly, tap the chart icon on the bottom navigation bar |
Once you land on the analytics page, set your date range first before reading any numbers. The dashboard defaults to the last 7 days, which is too short to surface meaningful trends. Switch to 28 or 60 days for a more accurate picture of how your account is actually performing.
Step 2. Navigate TikTok Studio tabs without missing data
Once you're inside the TikTok analytics dashboard, you'll see four main tabs at the top of the screen: Overview, Content, Followers, and LIVE. Each tab answers a different question about your account, and skipping any one of them means leaving useful signal on the table. Most creators only check Overview, which gives them a surface-level read but misses the detail that actually drives better decisions.
The four tabs and what to check in each
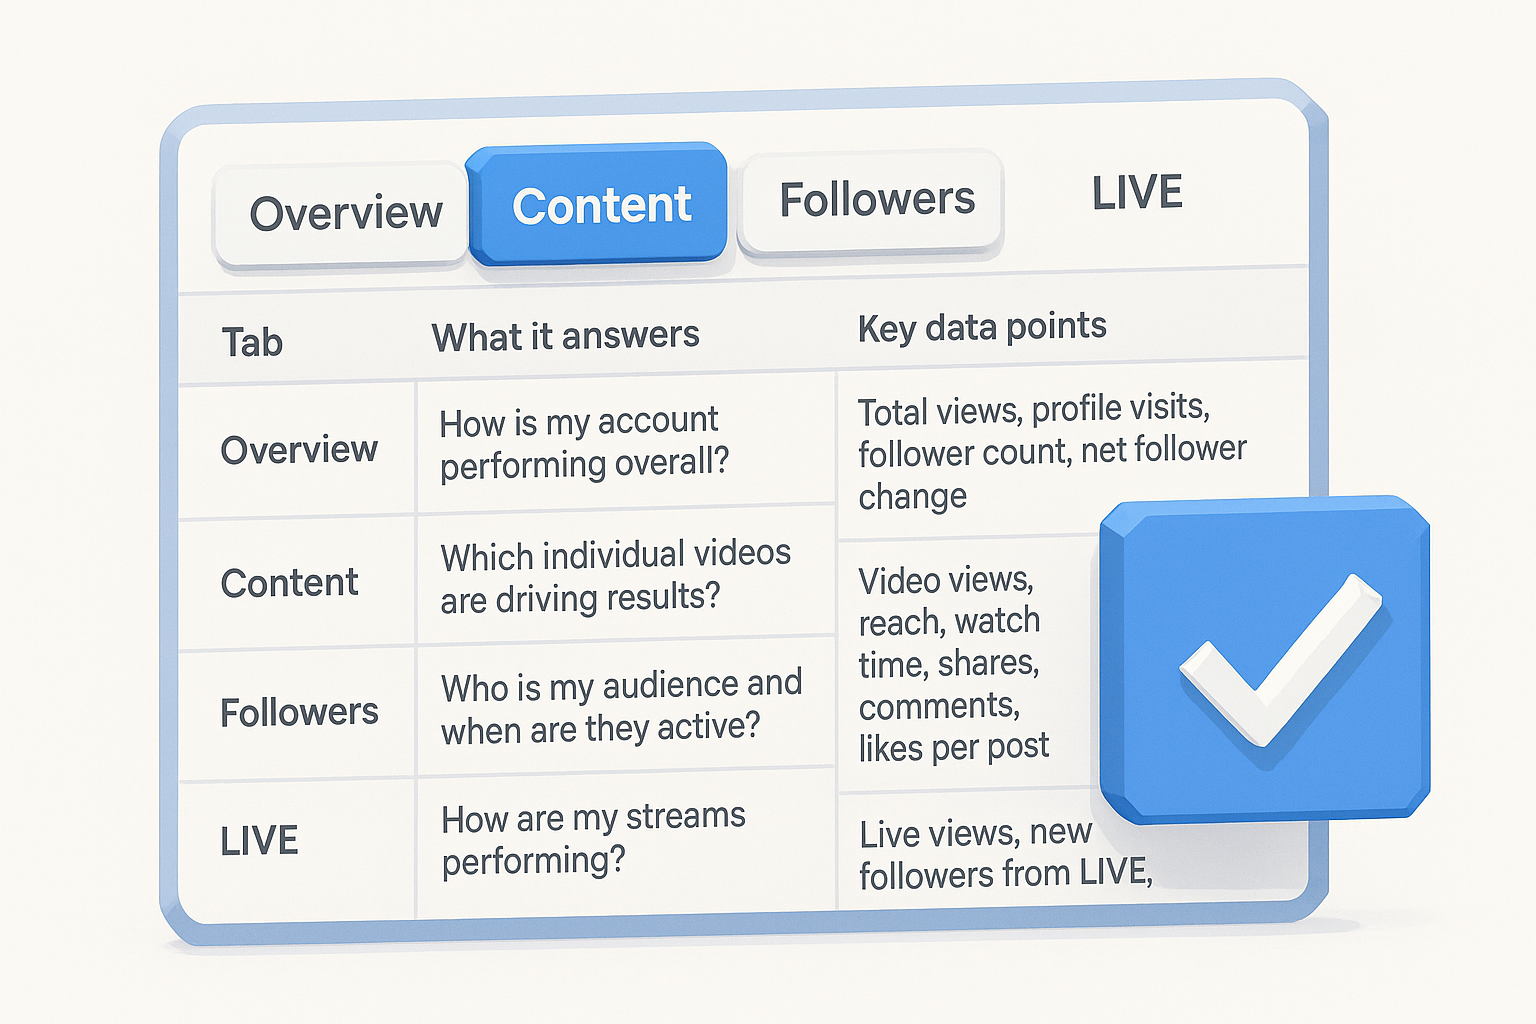
Every tab in TikTok Studio serves a distinct purpose, and knowing exactly what to look for in each one saves you from misreading your own data. The table below maps each tab to its primary use case so you can move through the dashboard efficiently.
| Tab | What it answers | Key data points |
|---|---|---|
| Overview | How is my account performing overall? | Total views, profile visits, follower count, net follower change |
| Content | Which individual videos are driving results? | Video views, reach, watch time, shares, comments, likes per post |
| Followers | Who is my audience and when are they active? | Age, gender, top territories, most active times |
| LIVE | How are my streams performing? | Live views, new followers from LIVE, diamonds, peak concurrent viewers |
Start with Overview to get your bearings, then move directly to Content to identify which specific posts are pulling the numbers up or down. Followers is where you validate whether your content is reaching the right people, not just a lot of people.
How to read the Content tab without skipping videos
The Content tab lists your recent videos in chronological order by default, but the most important step is sorting by metric rather than scrolling through every post manually. Click any column header to sort by views, likes, comments, or shares and surface your top performers instantly.
Pay attention to videos that have a high share count relative to views. A low-view video with disproportionate shares signals strong resonance with a specific audience segment, which is worth replicating.
For each standout video, click directly into it to see its individual performance breakdown, including audience retention curve and traffic source data. That second layer of data is where the real pattern recognition starts.
Step 3. Track the key metrics that actually matter
The TikTok analytics dashboard surfaces dozens of numbers, but most of them are noise if you look at them in isolation. Focus on the metrics that directly reflect whether your content is reaching new people, holding their attention, and prompting real action. Chasing follower count or raw views tells you very little about content quality or channel health.
Reach, engagement, and growth metrics
Your video reach tells you how many unique accounts saw a given post, which is a stronger signal than raw view count because it strips out repeat watches. Pair reach with your follower net change over the same period to see whether your content is actually converting viewers into followers or just generating passive impressions. Profile visits are another useful bridge metric: a spike in profile visits after a specific post tells you that video prompted genuine curiosity.
A high view count with low profile visits usually means the content entertained people but didn't make them want to know more about you. That's a signal to adjust your hook or call to action.
The table below maps out the metrics worth monitoring consistently and what each one tells you.
| Metric | What it signals |
|---|---|
| Video reach | Unique accounts exposed to your content |
| Watch time (total) | Overall content consumption volume |
| Average watch percentage | How well your video holds attention relative to its length |
| Shares | Audience finding the content worth sending to someone else |
| Profile visits | Viewer intent to learn more about your account |
| Net follower change | Whether content converts passive viewers into followers |
Watch time and retention
Average watch percentage is the single most honest metric on this entire list. A video watched to 80% on average performed far better than one with twice the views but a 20% average watch rate. TikTok's algorithm weights completion and re-watches heavily, so a short video watched all the way through multiple times signals quality more effectively than a longer video people abandon halfway through. Check this number first before drawing any conclusions about a post's performance.
Step 4. Diagnose why videos win or flop using patterns
Individual video metrics only tell part of the story. The real insight comes from comparing multiple posts side by side and looking for the patterns that separate high performers from everything else. Your TikTok analytics dashboard gives you exactly the raw material you need to run this kind of comparison, but you have to approach it systematically rather than eyeballing random videos.
Look for patterns across your top performers
Pull your top ten videos by average watch percentage, not by views. Once you have that list, look for structural similarities: video length, hook style, whether you used text overlays, whether you spoke directly to camera, and what topic category each video falls into. You're trying to find the variables that your best-performing content shares, not just celebrate that the numbers were good.
If eight out of ten of your top videos open with a direct question in the first two seconds, that's not a coincidence, that's a formula worth replicating intentionally.
A useful diagnostic template to apply across your top performers looks like this:
| Variable | Video A | Video B | Video C | Pattern? |
|---|---|---|---|---|
| Video length | Under 30s | Under 30s | 45s | Mostly short |
| Hook type | Question | Question | Statement | Mostly question |
| Text overlay | Yes | Yes | No | Mostly yes |
| Topic category | Tutorial | Tutorial | Story | Mostly tutorial |
| Avg. watch % | 78% | 82% | 41% | Higher on tutorials |
Fill this in for your actual top posts and the common variables will surface quickly without any guesswork.
Identify what your flops have in common
Run the same exercise on your bottom ten posts by average watch percentage. Look for shared characteristics: longer run times, weaker opening lines, missing text overlays, or topics that drifted away from your usual focus. Most creators find that their low performers cluster around a handful of repeatable mistakes rather than being randomly scattered across totally different formats.
Comparing winners and losers in the same framework gives you a direct picture of what your specific audience responds to, which is far more reliable than copying general TikTok best practices that weren't built around your content.
Step 5. Export, report, and keep a clean history
The TikTok analytics dashboard only retains account-level data for 60 days, so if you skip regular exports, you permanently lose the granular history you need for long-range reporting. Building a consistent export habit takes less than five minutes per month and gives you a running archive of your account's growth that the native platform never provides on its own.
How to export your data from TikTok
TikTok lets you download a CSV file directly from the analytics interface on desktop. Navigate to TikTok Studio, open the Analytics tab, set your date range, and click the "Export Data" button in the top right corner. The file includes overview metrics, individual video performance, and follower data for the selected period. Run this export at the end of every month, before the rolling window moves forward and permanently cuts off your oldest data.
Set a recurring monthly calendar reminder to export your analytics before the 60-day window resets, since TikTok will not notify you when historical data drops off.
Build a reporting template you can reuse
A clean spreadsheet template makes month-over-month comparisons fast and repeatable. The columns below give you a starting framework you can paste directly into a new Google Sheet or Excel file each month.
| Column | What to log |
|---|---|
| Month | Reporting period (e.g., March 2026) |
| Total video views | Sum from Overview tab |
| Net follower change | Gain minus loss for the period |
| Top video (by avg watch %) | Video title or link |
| Top video avg watch % | Percentage from Content tab |
| Average reach per post | Total reach divided by post count |
| Total shares | Sum across all posts |
Filling this in monthly builds a baseline you can use to spot growth trends, flag performance dips early, and present clear results to clients without rebuilding reports from scratch every time. Once your data lives in a spreadsheet, you can add simple percentage-change formulas to automatically calculate month-over-month shifts without manual math, which keeps your reporting accurate and your time spent on analysis rather than formatting.
Step 6. Add third-party tools and dashboards
The native TikTok analytics dashboard covers the basics, but it has real gaps: a 60-day data cap, no cross-platform comparison, and no automated reporting. Third-party tools fill those gaps by pulling your TikTok data into a persistent, longer-range view that you can layer alongside your Instagram, YouTube, or paid media numbers. If you manage multiple accounts or report to clients on a regular cadence, connecting at least one external tool is worth the setup time.
What third-party tools give you that TikTok doesn't
Third-party analytics tools typically pull data through TikTok's official API, which means they store your historical metrics far beyond TikTok's native limits. That gives you rolling 6-month or 12-month trend lines without manual CSV exports. Most tools also let you build custom dashboards that combine TikTok data with other platforms, so you can see whether a TikTok push is actually driving Instagram follows or website traffic without jumping between five different tabs.
The biggest practical advantage is automated weekly or monthly reporting, which removes the manual export step entirely and keeps your data history clean without any calendar reminders.
The table below outlines the core capabilities to look for when evaluating any third-party analytics connection.
| Capability | Why it matters |
|---|---|
| Historical data retention | Keeps metrics beyond TikTok's 60-day cap |
| Multi-platform view | Combines TikTok with Instagram, YouTube, and other channels |
| Scheduled report delivery | Sends performance summaries automatically via email |
| Custom date range filtering | Lets you pull exact periods for client reporting |
| Video-level drill-down | Surfaces per-post metrics outside TikTok Studio |
How to connect a reporting tool without breaking your data
Most tools connect through TikTok's official API, which requires you to authorize access through your TikTok account settings rather than sharing login credentials. Go to your TikTok account security settings, navigate to "Manage app permissions," and confirm which tools currently have authorized access. Revoke anything you don't recognize before connecting a new tool. Once connected, run a test pull covering the past 30 days and cross-check two or three video metrics against what TikTok Studio shows to confirm the data is pulling accurately before you build any reports on top of it.
Step 7. Fix common issues and questions
Even when your TikTok analytics dashboard is set up correctly, you'll occasionally run into data gaps, missing numbers, or metrics that just don't add up. Most problems have a straightforward cause, and knowing what to check first saves you from assuming something is broken when it's actually a settings or timing issue.
Analytics not showing up at all
If your analytics tab is missing or blank, the most common cause is account type. TikTok only enables analytics for Creator and Business Accounts, so check your account settings first and confirm you've completed the switch. If you recently switched and still see no data, give it 24 to 48 hours because TikTok takes time to initialize tracking after an account type change. A fresh account with very few posts may also show limited data until TikTok has enough activity to populate the dashboard.
Clearing your browser cache and reloading TikTok Studio resolves display issues in roughly half of reported cases where data appears missing but the account type is correct.
Video metrics that look wrong or stop updating
Individual video metrics sometimes freeze or update on a delay, particularly for posts published within the last 48 to 72 hours. TikTok processes engagement data in batches rather than in real time, so a video posted this morning may show incomplete numbers until tomorrow. If a post is older than three days and metrics still look frozen, open the video directly inside TikTok Studio and check whether the individual video detail page shows data that the main Content tab isn't reflecting yet.
Data gaps between TikTok and third-party tools
Discrepancies between what TikTok Studio shows and what your third-party reporting tool pulls usually trace back to API refresh timing. Third-party tools don't pull data in real time; most sync every 12 to 24 hours depending on their plan tier. If you're seeing a gap, check when your tool last pulled a sync and compare that timestamp against when the data you're questioning was recorded. Re-authorizing the TikTok API connection inside your third-party tool's settings fixes authentication errors that cause persistent sync failures.
Next steps for better TikTok decisions
Your TikTok analytics dashboard is the foundation, but the real advantage comes from acting on what the data tells you instead of just reading it. Start by exporting your last 60 days of data today and building the monthly tracking spreadsheet outlined in Step 5. Then run the pattern comparison from Step 4 on your top ten and bottom ten posts so you have a concrete picture of what your specific audience responds to before you record another video.
Once you know which formats and hooks perform best, the next challenge is scaling that output without starting from scratch every time. AI Flow Chat lets you feed your top-performing TikTok videos directly into an AI canvas, extract the patterns that made them work, and build repeatable content workflows around those formulas. That turns your analytics insights into a production system you can run consistently, not just a set of numbers you review once and forget.
Continue Reading
Discover more insights and updates from our articles
Writing SEO content without a clear brief is like building a house without blueprints, you'll waste time, miss key details, and end up reworking most of it. A good content brief generator takes the gu...
Every manual task inside your CRM, updating a lead status, sending a follow-up email, assigning a case to the right rep, costs time you could spend on work that actually moves revenue. Salesforce work...
Most people use "content strategy" and "content marketing strategy" interchangeably. They're not the same thing. The difference between them isn't just semantics, it affects how yo...