TubeBuddy YouTube Analytics: How To Track Growth & Benchmarks
At AI Flow Chat
Contents
0%YouTube gives you a wall of numbers, views, impressions, click-through rates, watch time, but raw data alone doesn't tell you what to do next. That's where TubeBuddy YouTube analytics comes in. It layers actionable context on top of YouTube Studio's native metrics, helping you benchmark your performance against competitors and spot growth opportunities you'd otherwise miss.
But tracking what works is only half the equation. The real payoff comes when you turn those insights into content. At AI Flow Chat, we built a visual AI workspace where creators drag YouTube videos directly onto an infinite canvas, extract what makes them perform, and generate new content based on proven patterns, not guesswork. TubeBuddy tells you what's working; tools like ours help you act on it.
This guide walks you through TubeBuddy's core analytics features step by step. You'll learn how to track channel growth over time, compare your metrics against similar creators, and use the data to make smarter decisions about your next video. Whether you're running a one-person channel or managing content for clients, these benchmarks give you a concrete baseline instead of publishing into the void and hoping for the best.
What TubeBuddy YouTube analytics includes and why it helps
TubeBuddy is a browser extension that installs directly on top of YouTube Studio, adding a layer of context that YouTube's native dashboard skips entirely. TubeBuddy YouTube analytics is built around two core modules: Videolytics, which breaks down individual video performance, and Channelytics, which tracks growth at the channel level over time. A third component, Keyword Explorer, connects search volume data to your publishing decisions so you are measuring what already happened and planning what to do next.
The real value isn't more numbers; it's the ability to see your metrics alongside competitor data on the same screen.
Videolytics: per-video performance breakdown
Videolytics appears as a sidebar panel whenever you open any YouTube video, including videos from channels you don't own. For your own uploads, it surfaces click-through rate, average view duration, and engagement rate in one consolidated view without forcing you to dig through multiple tabs in YouTube Studio. For competitor videos, it displays estimated view counts alongside the exact tags the creator used and how those tags rank in YouTube search.
The tag ranking feature is where Videolytics earns its place. If a competing video ranks in the top five for a term you're targeting, you can see their full tag list and compare it to yours immediately. This turns competitor metadata research from a manual, time-consuming task into something you can complete in under two minutes per video.
Channelytics: channel-level growth tracking
Channelytics gives you a growth dashboard for any public YouTube channel, including your own. You can set custom date ranges and track how subscriber counts, total views, and upload frequency shift over time. When you apply this to a competitor's channel, you can see whether their subscriber spike happened recently or plateaued months ago, which tells you a lot about whether their current strategy is actually working.
For your own channel, the most important feature is the ability to set a fixed benchmark date and measure every metric from that point forward. If you changed your thumbnail style, shifted your upload schedule, or started targeting a new topic cluster, you need a before-and-after snapshot to know whether the change produced results.
Keyword Explorer: turning search data into a content plan
Keyword Explorer scores each search term on a weighted scale that balances search volume against the competition level of existing videos. A high-volume term dominated by large channels scores lower than a mid-volume term with weaker competition, because the mid-volume term gives a smaller channel a realistic path to ranking on the first page.
Each scored term also comes with related keyword suggestions, ranked by the same weighted formula. This makes it straightforward to build a content calendar around terms your channel can realistically win rather than chasing high-volume terms where you have no realistic chance of appearing in search results.
Step 1. Set up tracking and define your baseline
Before you can measure growth, you need a fixed starting point. Without one, you're comparing random snapshots that don't tell you whether a specific decision moved the needle. Setting a baseline date in TubeBuddy YouTube analytics ties every metric change to a moment in time, so you always know what you're measuring against.
Install the extension and connect your channel
TubeBuddy installs as a browser extension for Chrome, Firefox, or Edge directly from your browser's extension store. Once installed, visit YouTube and log in to your Google account. TubeBuddy will prompt you to authorize access to your channel. Start with the free plan since it includes Channelytics and basic Videolytics features, and upgrade only if you need deeper keyword data or bulk processing tools.
The free plan gives you enough analytics access to establish a solid baseline and start making data-driven decisions before committing to a paid tier.
Record your baseline numbers
Open your YouTube Studio dashboard, then navigate to any video or your channel overview with TubeBuddy active in your browser. Write down the following six numbers before you change anything about your content strategy:
| Metric | Where to find it |
|---|---|
| Subscriber count | Channelytics overview panel |
| 28-day view total | YouTube Studio > Analytics |
| Average click-through rate | YouTube Studio > Reach tab |
| Average view duration | YouTube Studio > Engagement tab |
| Top-performing video (views) | Videolytics sidebar |
| Upload frequency (videos per month) | Channelytics upload history |
Save these numbers in a simple spreadsheet with today's date as the column header. Every four weeks, add a new column with updated figures. This gives you a rolling comparison that shows whether your decisions produce measurable results or stall out. Treat this spreadsheet as your single source of truth for channel performance rather than relying on the view notifications you see on your phone.
Step 2. Use Videolytics to spot what drives performance
Once your baseline is set, Videolytics becomes your primary tool for diagnosing why specific videos perform the way they do. Open any video on YouTube with TubeBuddy active in your browser, and the sidebar panel loads automatically. For your own uploads, the panel pulls in click-through rate, watch time percentage, and engagement data alongside the tag list and search ranking for each tag. This gives you a single screen to work from instead of switching between four tabs in YouTube Studio.
Check your watch time pattern first
Average view duration is the metric that reveals where your content loses the audience. When you open Videolytics on one of your videos, look at the duration percentage. If your 10-minute video shows 48% average view duration, that means viewers are leaving around the 4-minute 48-second mark on average. Cross-reference that timestamp with your actual video content to identify what topic or segment is causing the drop-off.
A retention drop in the first 30 seconds almost always points to a hook problem, not a content quality problem.
Use this three-step check each time you review a video:
- Note the average view duration percentage.
- Find the corresponding timestamp in your video.
- Identify whether the drop happens during an intro, a topic transition, or a specific segment.
Compare your tags to a top-ranking competitor
TubeBuddy YouTube analytics lets you open a competitor's video and view their complete tag list in the Videolytics sidebar. Find a video that ranks above yours for a shared keyword, then record both tag lists in the template below for a direct side-by-side comparison.
| Category | Your tags | Competitor tags |
|---|---|---|
| Single-word tags | (list yours) | (list theirs) |
| 2-word phrase tags | (list yours) | (list theirs) |
| 3-5 word phrase tags | (list yours) | (list theirs) |
Look for specific phrase-match tags that are three to five words long in their list but absent from yours. Short single-word tags rarely drive search traffic on their own, so prioritize the longer, precise phrases your competitor uses that you haven't tested yet.
Step 3. Benchmark competitors with Channelytics
Channelytics turns competitor research from a guessing game into a structured comparison. Open any public YouTube channel with TubeBuddy active, click the TubeBuddy tab on the channel page, and the panel loads a growth timeline showing subscriber count, total views, and upload frequency over a date range you control. This is how you figure out whether a competitor's channel is actively growing or coasting on momentum it built two years ago.
Find the right channels to compare against
Picking the wrong competitor channel gives you useless data. You want channels that target the same audience and are within a similar size range, roughly 0.5x to 2x your current subscriber count. A channel ten times your size operates under completely different algorithm conditions, so their growth rate tells you nothing actionable about your situation.
Use this template to track three competitor channels each month:
| Channel name | Subscriber count | 28-day view total | Uploads this month | Subscriber growth rate |
|---|---|---|---|---|
| Competitor A | ||||
| Competitor B | ||||
| Competitor C |
Fill in one column per month to build a comparison trend over time. When a competitor's subscriber growth rate jumps, cross-reference Channelytics to see which upload triggered it.
Read the growth signals correctly
TubeBuddy YouTube analytics surfaces upload frequency alongside subscriber growth, which is the pairing most creators overlook. If a competitor gained 4,000 subscribers in a month but only published two videos, one of those videos carried almost all of the growth. Open those specific videos in Videolytics to find what topic or format drove the result.
A sudden growth spike tied to a single video is a stronger signal than steady growth spread across ten uploads, because it points to one specific formula worth replicating.
Look for a pattern across at least three months before drawing conclusions. Single-month spikes can come from external traffic sources that have nothing to do with YouTube's recommendation system.
Step 4. Turn analytics into a simple weekly workflow
Collecting data only helps you if you review it on a consistent schedule. TubeBuddy YouTube analytics works best when you attach it to a fixed weekly routine rather than checking numbers whenever you feel like it. A repeatable system keeps you from making reactive decisions based on a single video's performance and trains you to look for patterns across multiple uploads instead.
Set aside 20 minutes every Monday
Monday is the right day to review the previous week's data because YouTube's algorithm typically settles video performance within five to seven days of publishing. Open Channelytics for your channel and record your subscriber count and weekly view total in your tracking spreadsheet. Then pull up your most recent upload in Videolytics and compare the click-through rate and average view duration against the baseline numbers you recorded in Step 1.
If your latest video's click-through rate sits more than two percentage points below your channel average, fix the thumbnail or title before you publish the next video.
Use a weekly review template
Run through the same five checks every Monday to keep your review focused and repeatable. Copy this template into a spreadsheet and fill in one row per week:
| Check | Where to look | Action if off-track |
|---|---|---|
| Subscriber delta | Channelytics 7-day change | Compare to upload count |
| Click-through rate | Videolytics on latest upload | Test a new thumbnail |
| Average view duration | Videolytics on latest upload | Find and fix the drop-off point |
| Top tag ranking | Videolytics tag panel | Swap underperforming tags |
| Competitor update | Channelytics on one competitor | Note their topic and format |
Completing this review takes under 20 minutes once you know where each metric lives. Stick to the same template for at least four consecutive weeks before changing your content strategy, because one or two weeks of data never reveal a reliable pattern on their own.
Wrap-up and what to do next
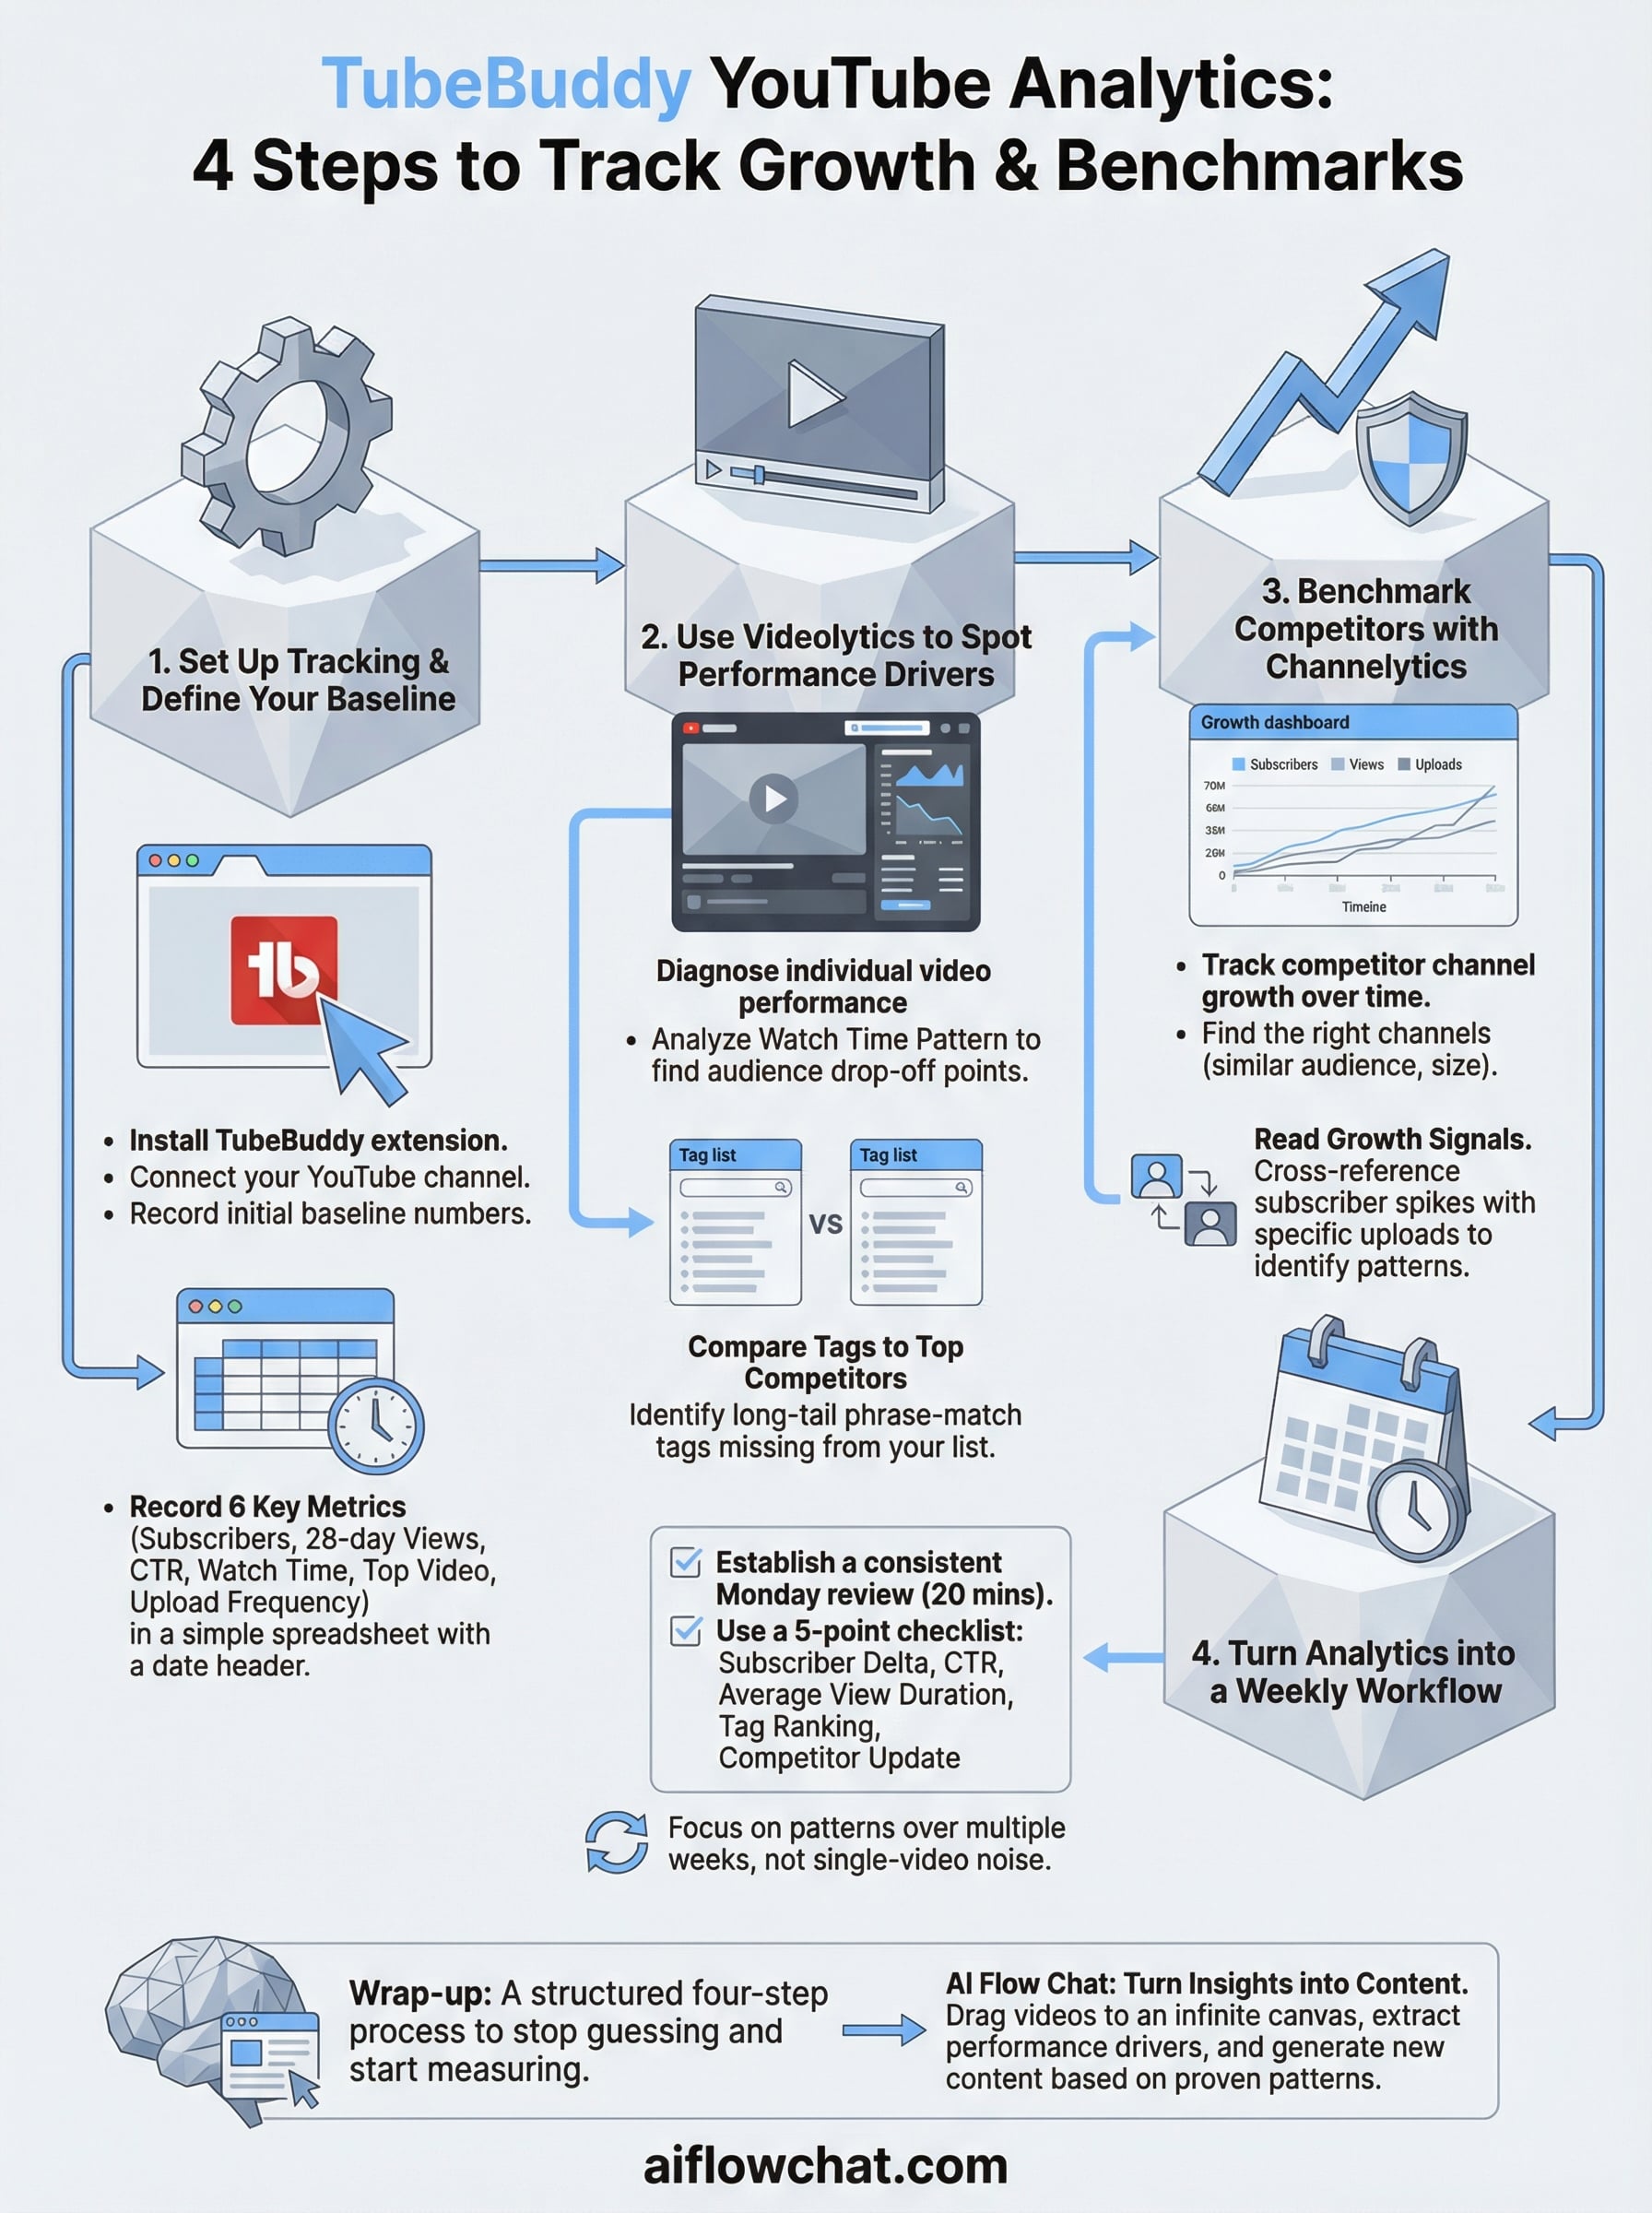
TubeBuddy YouTube analytics gives you a structured way to stop guessing and start measuring. You now have a four-step process: set a baseline, diagnose individual video performance with Videolytics, benchmark competitors with Channelytics, and run a consistent Monday review that keeps your decisions grounded in patterns instead of single-video noise. Each step builds on the last, so skipping one leaves a gap in your analysis.
Knowing what works is only the first half of the job. The second half is turning those insights into content fast enough to act on them. AI Flow Chat lets you drag any YouTube video onto a visual canvas, extract the hooks and formats that drove its performance, and build new content from those proven patterns directly inside the same workspace. If you want to move from data to published content without bouncing between six tools, try AI Flow Chat and see how the workflow fits.
Continue Reading
Discover more insights and updates from our articles
Writing SEO content without a clear brief is like building a house without blueprints, you'll waste time, miss key details, and end up reworking most of it. A good content brief generator takes the gu...
Every manual task inside your CRM, updating a lead status, sending a follow-up email, assigning a case to the right rep, costs time you could spend on work that actually moves revenue. Salesforce work...
Most people use "content strategy" and "content marketing strategy" interchangeably. They're not the same thing. The difference between them isn't just semantics, it affects how yo...