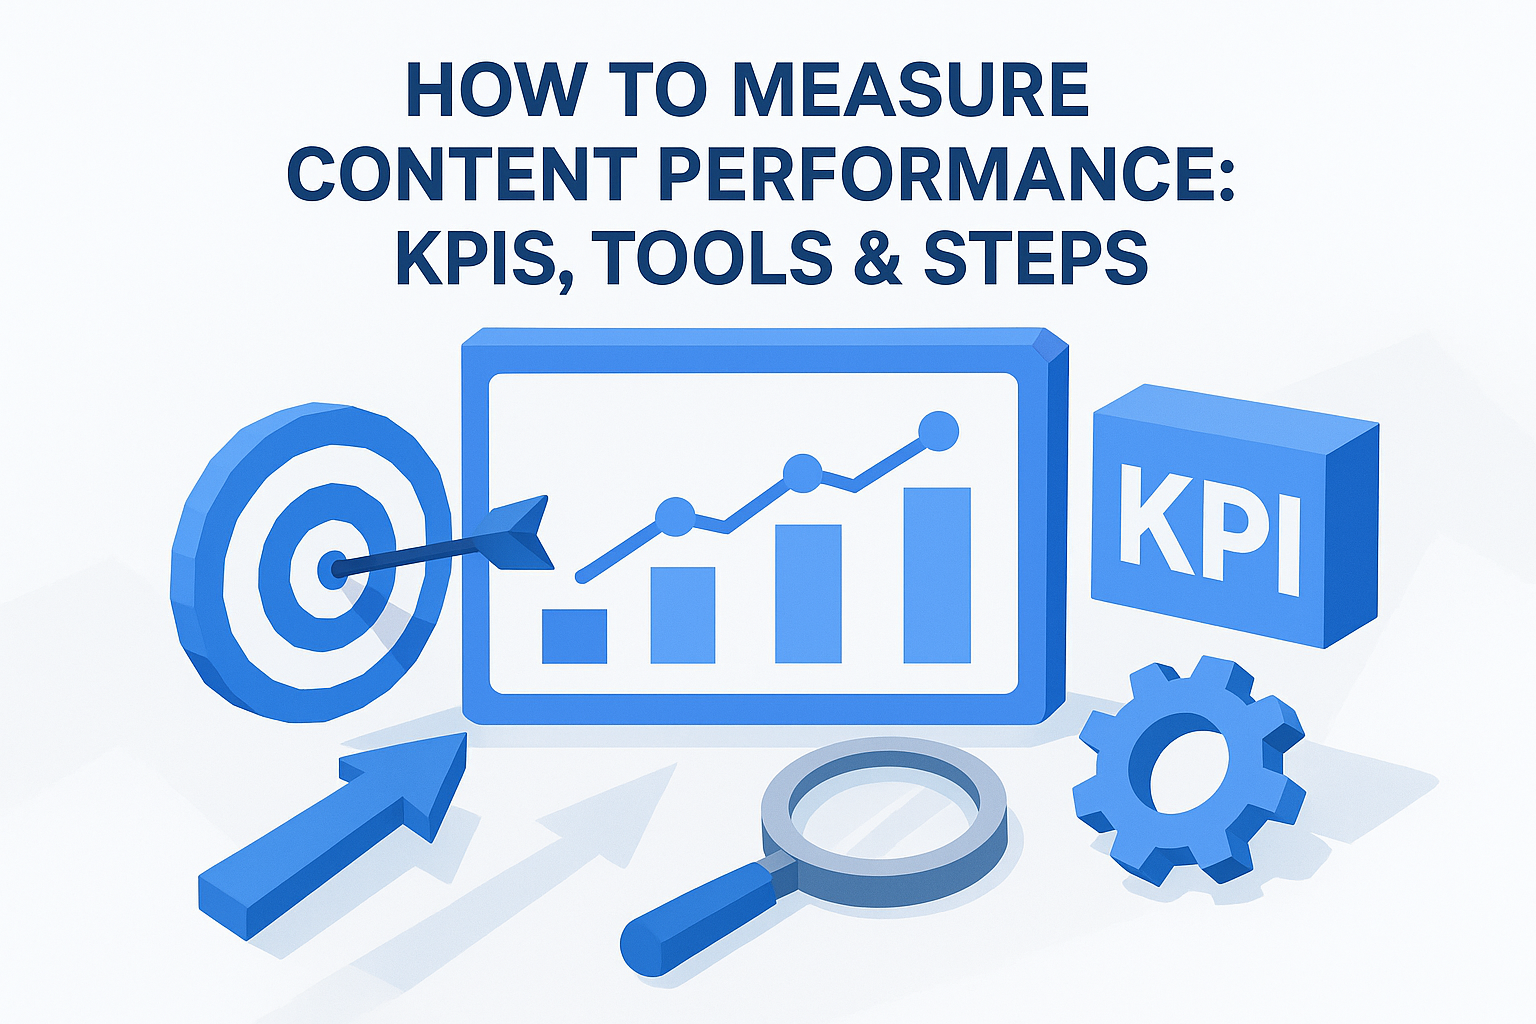
How to Measure Content Performance: KPIs, Tools & Steps
At AI Flow Chat
Contents
0%You published 20 posts last month. Some got traction, others disappeared into the void. But which ones actually moved the needle, and why? Without a clear system for how to measure content performance, you're essentially guessing what works and hoping the next piece lands better.
The problem isn't a lack of data. Most creators and marketers are swimming in it. Platform dashboards throw dozens of numbers at you, impressions, reach, saves, shares, click-through rates, and none of it means much until you know which metrics map to your actual goals. A viral TikTok that drives zero conversions isn't a win. A blog post with modest traffic but a 12% email opt-in rate might be your best asset.
This guide breaks down the specific KPIs worth tracking, the tools that make measurement practical, and a step-by-step process to turn raw data into decisions you can act on. And once you know what's working, platforms like AI Flow Chat make it straightforward to feed those winning content patterns directly into AI workflows, so you can reverse-engineer your top performers and replicate them at scale instead of starting from scratch every time.
What content performance means and why it matters
Content performance is not just a traffic report. It's a structured way to understand whether your content is actually doing the job you assigned it, whether that job is building awareness, capturing leads, or driving sales. When you learn how to measure content performance properly, you stop treating every piece as a gamble and start treating your content library as a system with predictable inputs and outputs you can actually improve over time.
The difference between output and impact
Most creators track output: how many posts went live, how many words were written, how many videos were uploaded. That's production data, and it tells you almost nothing about whether your content is working. Impact metrics, on the other hand, tell you what happened after someone consumed your content. Did they sign up? Did they share it? Did they come back? Output measures your effort; impact measures your results. The gap between those two things is exactly where most content strategies break down silently.
Tracking output without tracking impact is like logging gym sessions without checking whether you're getting any stronger.
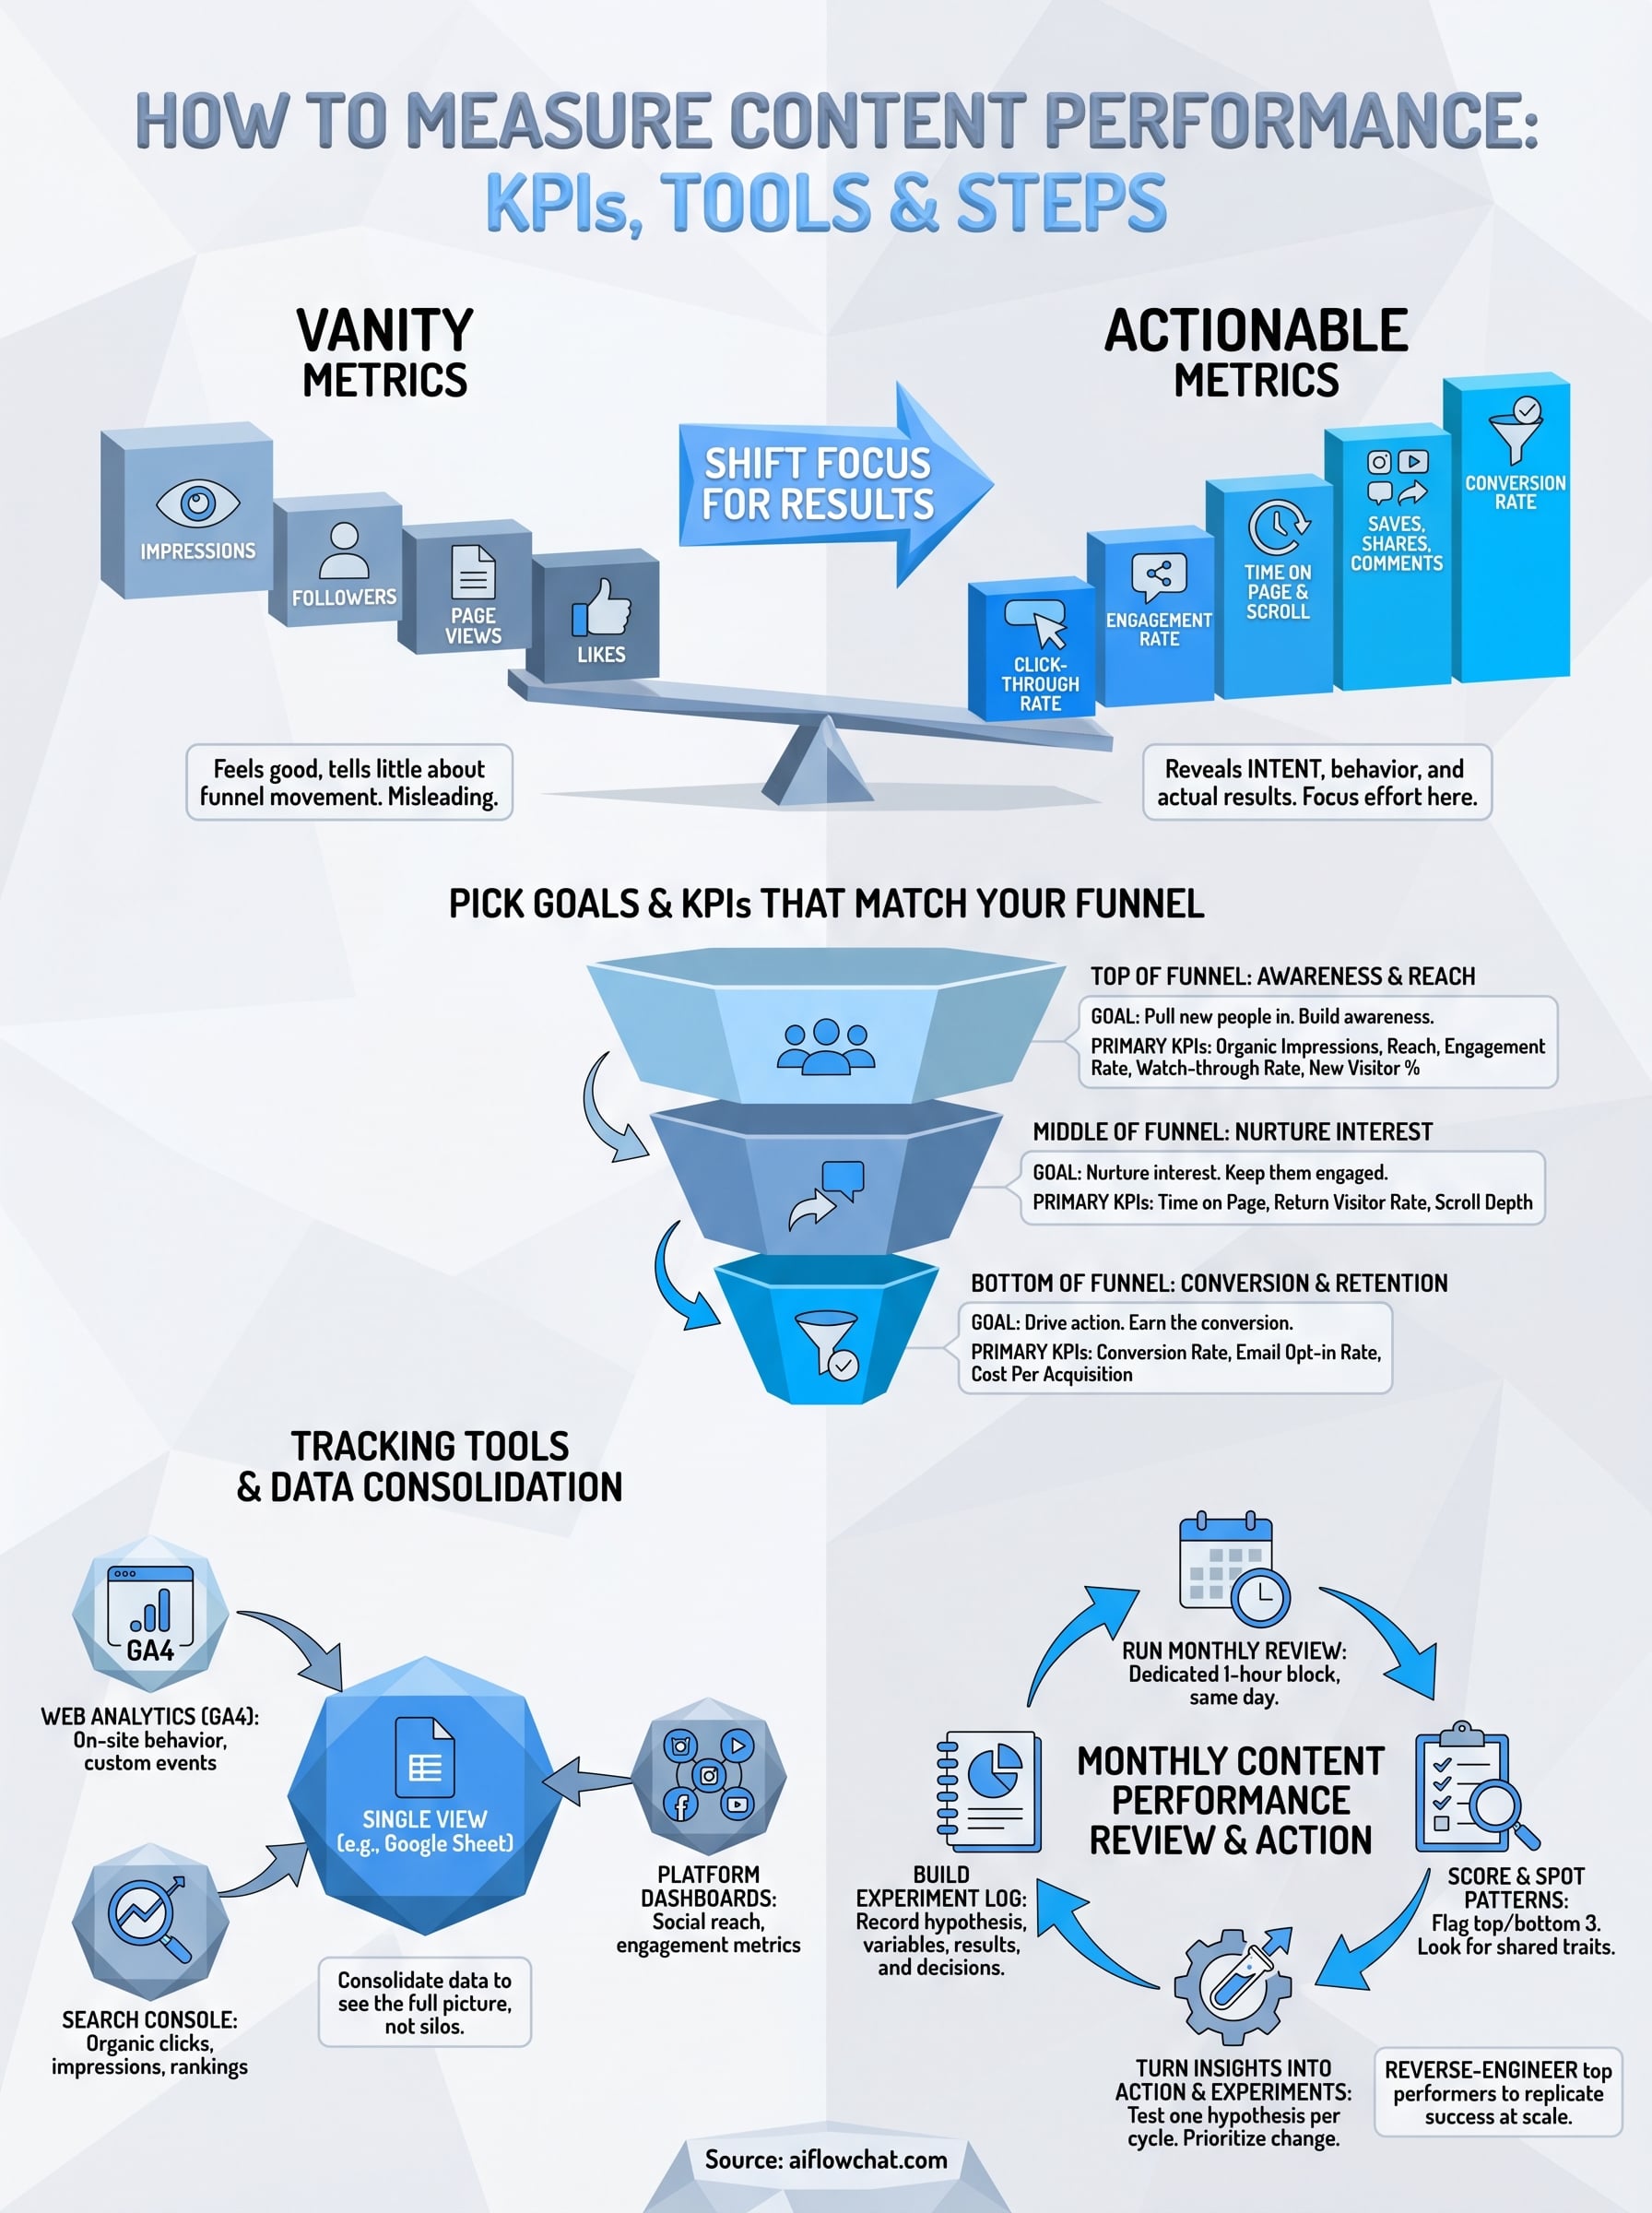
Why vanity metrics mislead you
Vanity metrics are numbers that look impressive but don't connect to any real business outcome. A post with 50,000 impressions sounds like a win until you realize it generated zero clicks, zero saves, and zero downstream actions. These numbers feel good in a dashboard and look solid in a report, but they don't tell you whether your content is moving anyone down your funnel. The metrics that actually matter are tied to specific audience behavior, things like time on page, scroll depth, conversion rate, or return visitor rate, because those numbers reveal intent, not just exposure.
Here's a quick comparison of vanity metrics versus actionable ones:
| Vanity Metric | What It Actually Tells You | Actionable Alternative |
|---|---|---|
| Total impressions | Your content was shown | Click-through rate |
| Follower count | Your account exists | Engagement rate per post |
| Page views | Someone landed on the page | Time on page and scroll depth |
| Likes | Someone tapped a button | Saves, shares, and comments |
| Video views | The video started playing | Watch-through rate |
Shifting your focus from vanity to actionable metrics gives you a clearer picture of what's actually driving results without publishing a single additional piece. You start seeing which formats and topics produce real audience behavior, and that data tells you exactly where to concentrate your effort next.
Pick goals and KPIs that match your funnel
Before you can learn how to measure content performance effectively, you need to connect your metrics to specific funnel stages. A single list of KPIs doesn't serve every content goal. Awareness content, conversion content, and retention content each demand a different set of measurements, and mixing them up leads to bad conclusions.
Top-of-funnel KPIs: awareness and reach
Top-of-funnel content is designed to pull new people in. The KPIs that matter here focus on reach and engagement quality, not conversions. You want to know whether your content is reaching the right people and whether they find it interesting enough to stick around.
Useful top-of-funnel KPIs to track:
- Organic impressions and reach
- Engagement rate (comments, shares, saves per post)
- Watch-through rate on video content
- New visitor percentage in your blog analytics
If your top-of-funnel content is getting shown but not engaged with, the problem is usually the hook, not the distribution.
Bottom-of-funnel KPIs: conversion and retention
Bottom-of-funnel content needs to do actual work. These pieces target people who already know you exist and need a reason to act. Your conversion rate, email opt-in rate, and cost per acquisition are the numbers that tell you whether that content is earning its place. Track these separately from awareness metrics, or you will dilute the signal and draw the wrong conclusions about what is performing.
Use this goal-to-KPI mapping as a starting template:
| Funnel Stage | Content Goal | Primary KPI |
|---|---|---|
| Top | Build awareness | Engagement rate |
| Middle | Nurture interest | Time on page, return visits |
| Bottom | Drive action | Conversion rate, opt-in rate |
Set up your tracking tools and data sources
Before you run a single review, you need your data flowing into the right places. The biggest mistake most creators make is relying on platform-native dashboards in isolation, which gives you siloed numbers that never connect to the full picture. A proper tracking setup puts your web analytics, social data, and conversion data in a format you can actually compare side by side when you sit down to measure content performance.
Connect your core analytics platforms
Your foundation is Google Analytics 4 (GA4), which tracks on-site behavior across every blog post, landing page, and content asset you own. Set up GA4 with custom events for the actions that matter to your funnel, things like scroll depth, button clicks, and form submissions. Without custom events, you only see surface-level traffic and miss the behavioral signals that tell you whether your content is actually working.
GA4's exploration reports let you build custom funnels that show exactly where readers drop off after landing on a content piece, which is far more useful than a raw pageview count.
Here is a minimal tracking stack that covers most creator and marketer use cases:
| Tool | What It Tracks | Why You Need It |
|---|---|---|
| Google Analytics 4 | On-site behavior, conversions | Full user journey data |
| Google Search Console | Organic clicks, impressions, rankings | SEO content performance |
| Platform dashboards | Social reach, engagement, video metrics | Channel-specific KPIs |
Consolidate your data into one view
Pulling from three separate dashboards every month wastes time and increases the risk of misreading patterns. Use a simple Google Sheet to consolidate your key numbers weekly. Map each metric to the funnel stage it belongs to so comparisons stay meaningful and you always know which number answers which question.
Run a monthly content performance review
A monthly cadence is the right rhythm for most creators and marketers learning how to measure content performance. Weekly reviews create noise because short-term fluctuations obscure real trends, while quarterly reviews leave you too far behind to course-correct. Set a recurring one-hour block on the same day each month and treat it as a fixed appointment rather than something you fit in when time allows.
Consistency in your review schedule matters as much as the metrics you track - a skipped month breaks the trend lines you need to spot real patterns.
Pull your numbers in one sitting
Start every review by pulling data from all three sources - GA4, Google Search Console, and your platform dashboards - into your consolidation sheet before you analyze anything. Resist the urge to interpret individual numbers as you collect them. Fill in your template first, then look at the full picture. This prevents you from fixating on one strong performer and missing a quiet drop somewhere else.
Use this monthly review template as your starting structure:
| Content Piece | Funnel Stage | Primary KPI | This Month | Last Month | Change |
|---|---|---|---|---|---|
| [Post title] | Top | Engagement rate | 4.2% | 3.1% | +35% |
| [Post title] | Bottom | Opt-in rate | 8.5% | 9.0% | -5.5% |
Score each piece and spot the patterns
Once your sheet is populated, flag every piece that significantly outperformed or underperformed its baseline. You don't need to evaluate every post in equal depth. Focus your attention on the top three performers and the bottom three, then look for shared characteristics across each group. Same format? Same topic cluster? Same call-to-action structure? Those patterns carry the signal you are actually looking for.
Turn insights into action and experiments
Data only becomes useful when it drives a decision. Once you know which pieces outperformed and which ones fell flat, the next step in learning how to measure content performance is converting those patterns into deliberate, testable changes rather than random rewrites.
Prioritize one change at a time
The patterns you surface in your monthly review will point to multiple opportunities at once, but changing too many variables simultaneously makes it impossible to know what actually caused any shift in performance. Pick one hypothesis per cycle and test it cleanly. If your top performers all opened with a direct question, test that format on three upcoming pieces and check whether engagement rate improves before you layer in another variable.
One focused experiment produces clearer signal than five simultaneous changes ever will.
Concrete examples of single-variable experiments worth running:
- Test a direct question hook vs. a bold statement hook across five posts
- Add an email opt-in within the first 300 words of your top three blog posts and measure the change in opt-in rate
- Swap a long-form CTA paragraph for a single sentence link and track click-through rate
Build a simple experiment log
Tracking your experiments in a separate log prevents you from losing the learnings between monthly reviews. A simple table captures everything you need without adding overhead.
| Experiment | Hypothesis | Variable Changed | Content Pieces Tested | Result | Decision |
|---|---|---|---|---|---|
| Question hook test | Direct questions increase engagement rate | Opening hook format | 5 posts | +28% engagement | Roll out to all new posts |
| Early opt-in placement | Earlier CTA increases sign-ups | CTA position | 3 blog posts | +11% opt-in rate | Apply to top 10 existing posts |
Fill in each row immediately after the test period ends so you build a running record of what has worked and what has not. Over time, this log becomes a decision-making reference that makes every future content cycle faster and more deliberate.
Wrap up and keep improving
Learning how to measure content performance is not a one-time setup. It's a repeating cycle: pick the right KPIs for your funnel stage, build a clean tracking stack, run a monthly review, and test one focused experiment per cycle. Each round makes the next one sharper because you accumulate a clear record of what works for your specific audience instead of recycling guesses.
The creators who pull ahead are the ones who close the loop between measurement and execution. Once you know which formats, hooks, and CTAs drive real results, the natural next step is replicating those patterns faster and at scale. AI Flow Chat lets you feed your top-performing content directly into visual AI workflows so you can extract what made it work and produce more of it without starting from scratch every time.
Continue Reading
Discover more insights and updates from our articles
Writing SEO content without a clear brief is like building a house without blueprints, you'll waste time, miss key details, and end up reworking most of it. A good content brief generator takes the gu...
Every manual task inside your CRM, updating a lead status, sending a follow-up email, assigning a case to the right rep, costs time you could spend on work that actually moves revenue. Salesforce work...
Most people use "content strategy" and "content marketing strategy" interchangeably. They're not the same thing. The difference between them isn't just semantics, it affects how yo...