Google Search Console Performance Report: How To Use It
At AI Flow Chat
Contents
0%The Google Search Console Performance Report is one of the most valuable free tools Google gives you, and most people barely scratch the surface of what it can do. It tells you exactly which queries bring people to your site, how often your pages show up in search results, and where you rank for each keyword. If you're creating content and not checking this report regularly, you're flying blind.
For creators and marketers who use AI Flow Chat to produce content at scale, pulling from viral videos, competitor ads, and reference materials, the performance report closes the feedback loop. You can see which topics actually gain traction in search, then feed those insights back into your workflows to double down on what works. Data-informed content creation beats guesswork every time.
This guide walks you through everything you need to know about the performance report: how to access it, what each metric means (clicks, impressions, CTR, average position), and how to pull actionable SEO insights from the data. Whether you're an SEO specialist, a solopreneur managing your own blog, or an agency owner reporting to clients, you'll leave with a clear understanding of how to use this report to improve your search visibility.
Step 1. Open the performance report the right way
Before you can interpret any data, you need to make sure you're looking at the right view. Many users land in the wrong property or skip verifying their setup, which means the performance data they see is incomplete or misleading. Taking two minutes to confirm you're in the correct property and starting filter state saves you from drawing wrong conclusions about your site's actual search traffic and wasting time optimizing pages that don't need it.
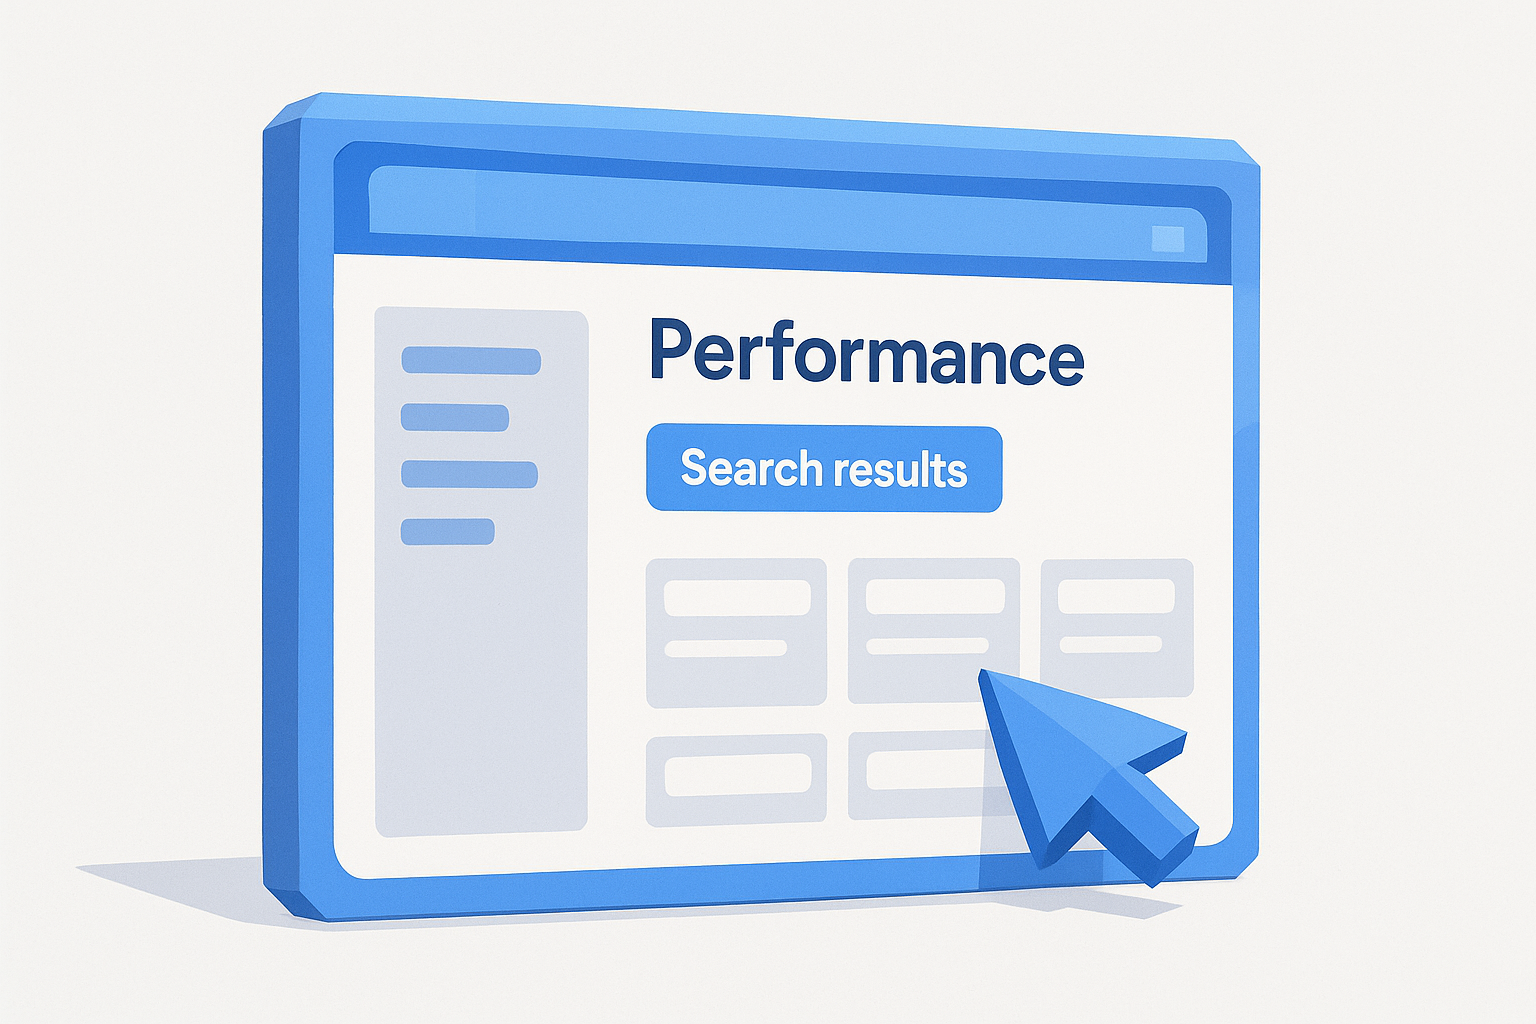
Navigate to the report in Google Search Console
Go to Google Search Console and sign in with the Google account that has access to your property. Once you're inside, look at the left sidebar and click "Performance", then select "Search results" from the submenu that appears. This is the core google search console performance report you'll use for the majority of your SEO analysis. The other options in that menu, like "Discover" and "Google News," pull from entirely different surfaces and show separate data.
Here's the exact navigation path:
- Go to search.google.com/search-console
- Select your property from the dropdown at the top left
- In the left menu, click Performance
- Click Search results (not "Discover" or "Google News")
- Confirm that the four metric boxes, Clicks, Impressions, Average CTR, and Average Position, are visible at the top of the report
If you don't see your site listed in the property dropdown, you haven't added and verified it yet. Go to "Add property" and complete Google's verification process before moving forward.
Choose the right property type
Google Search Console supports two property types: Domain properties and URL-prefix properties. A Domain property covers all subdomains and both HTTP and HTTPS versions of your site, giving you a complete picture of your search presence. A URL-prefix property only covers the exact URL you entered, such as https://yoursite.com, which means traffic to http://yoursite.com or blog.yoursite.com won't show up in your data.
If you have both property types added in your account, always use the Domain property when you want site-wide performance data. If your goal is to isolate a specific subdomain or subdirectory, the URL-prefix property serves that purpose. Choosing the wrong one is a common mistake that leads to under-reporting clicks and impressions, which distorts every analysis you run after.
Check your data freshness before drawing conclusions
Google Search Console does not show real-time data. Performance data typically lags two to four days, and lower-traffic sites can experience delays of up to a week. This means if you published a new article yesterday, you won't see meaningful impressions or clicks for several more days.
You can check the freshness of your data by looking at the date range selector at the top of the report. The default range is usually the last three months, but the end date reflects where Google's data processing currently stops. Keep this lag in mind when you're assessing recent content launches or tracking a campaign. Comparing data from the past 48 hours to older periods will skew your numbers and lead to conclusions that don't hold up once the full data populates.
Step 2. Set date ranges and compare periods
The date range you choose in the google search console performance report directly shapes every number you see. A 7-day range shows you recent spikes or drops, while a 12-month range smooths out fluctuations and reveals longer trends. Most people stick with the default 90-day window and stop there, which works fine for general analysis but misses the nuance you need to make confident decisions about your content strategy.
Pick the right date range for your goal
Not every question needs the same time window. Short ranges (7 to 28 days) work best for diagnosing a specific issue, like whether a recently published page is gaining impressions or why clicks dropped last week. Longer ranges (6 to 16 months) are better for spotting seasonal patterns, evaluating a content strategy over time, or understanding how a site migration affected search visibility.
To change the date range, click the date selector at the top of the report, choose "Custom range," and enter your start and end dates. Google caps historical data at 16 months, so don't expect to pull data beyond that window regardless of how long your site has been active.
Compare periods to catch real changes
The comparison feature is one of the most useful functions in the report, and most users skip it entirely. To activate it, click the date range selector, toggle on "Compare," and choose between "Previous period" or "Custom." When you compare periods, the report adds a second set of data lines to your graph and a difference column to your tables, showing the percentage change in clicks, impressions, CTR, and position for each query and page.
Use period comparison right after a site update, algorithm change, or content push to isolate whether your changes actually moved the needle.
For example, if you updated five blog posts in March, compare March to February in the Queries and Pages tabs below the chart. Sort by the difference column to see which pages gained or lost clicks. This tells you immediately which updates worked and which need more attention. A simple before-and-after comparison takes about 60 seconds and surfaces data that would otherwise take hours of manual analysis to piece together.
Step 3. Understand clicks, impressions, CTR, and position
The four metrics at the top of the google search console performance report are not just vanity numbers. Each one measures a different part of the search journey, from your page appearing in results to a user actually landing on your site. Reading them in isolation gives you a partial picture; understanding how they interact tells you where the real problem or opportunity sits.
What each metric actually measures
Before you draw any conclusions from the report, make sure you're clear on what Google is counting for each metric.
| Metric | What it measures |
|---|---|
| Clicks | The number of times a user clicked through to your site from a Google search result |
| Impressions | How many times your page appeared in search results, whether the user scrolled to see it or not |
| Average CTR | Clicks divided by impressions, expressed as a percentage |
| Average Position | The mean ranking position of your page across all queries that triggered an impression |
One important detail: impressions count even if your result appeared below the fold and the user never scrolled to see it. This means a high impression count with low clicks can reflect a ranking problem, not just a content problem.
How the four metrics work together
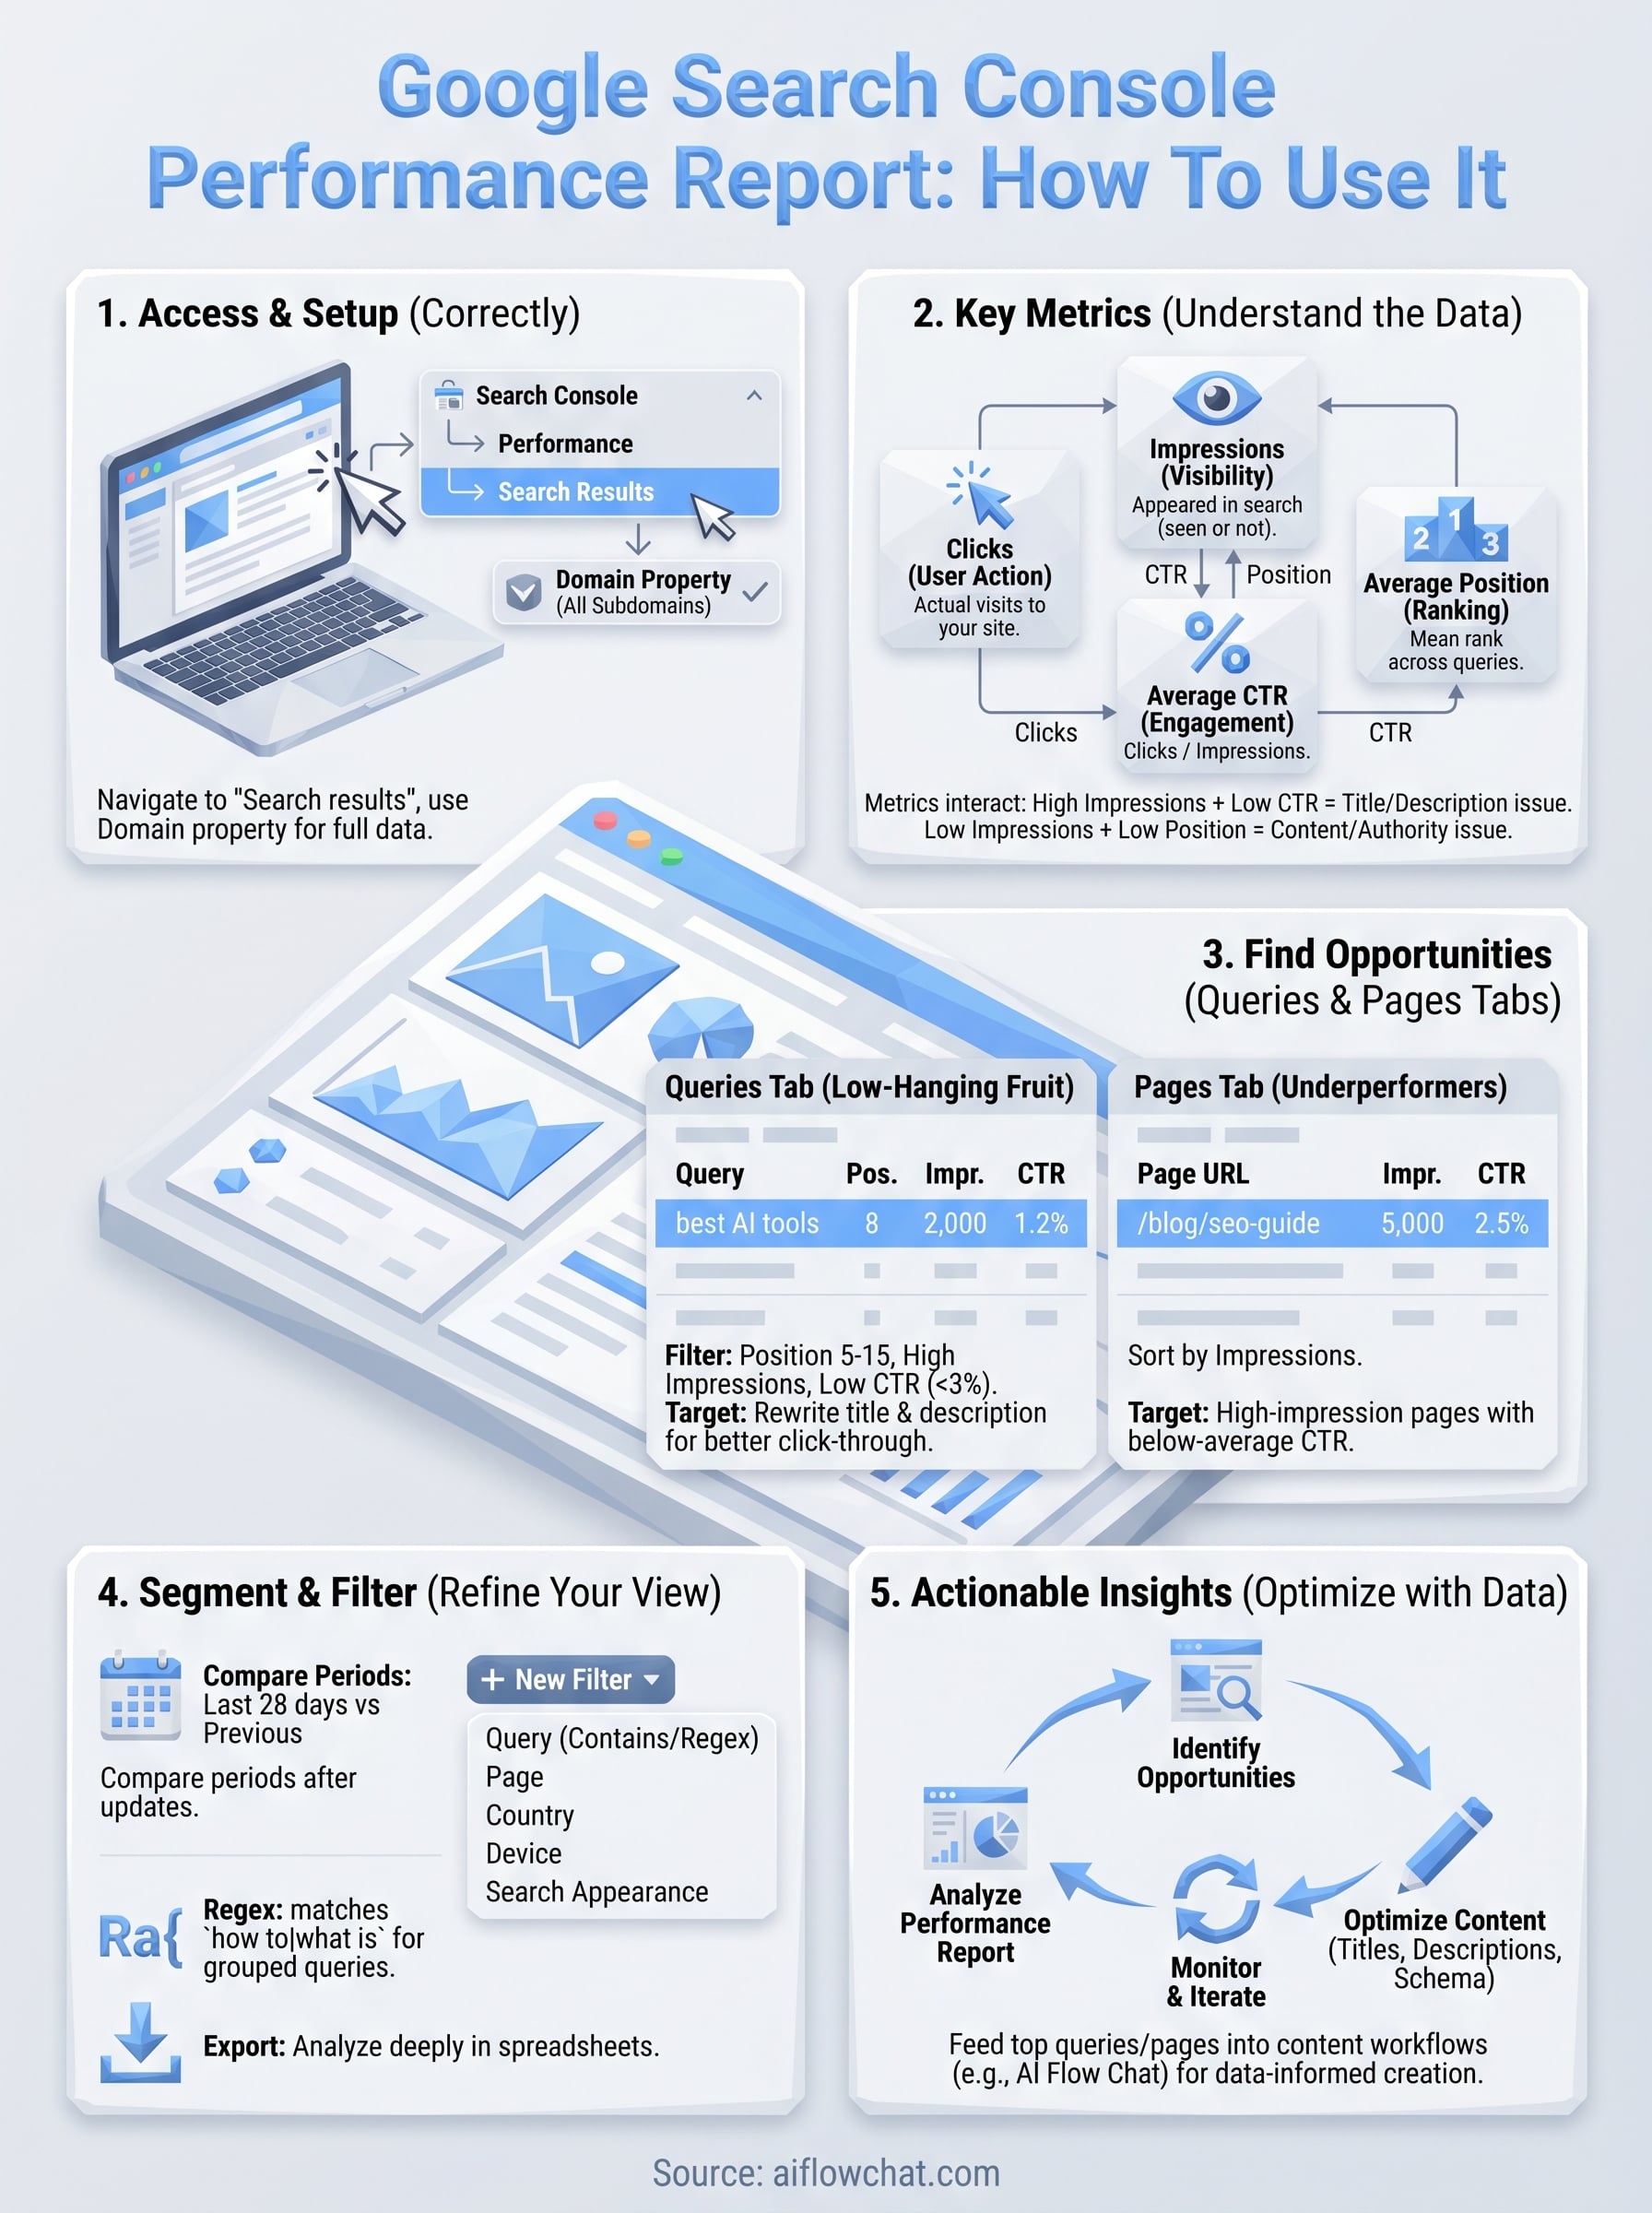
Each metric points to a different lever you can pull. High impressions with a low CTR means your page is showing up in search but your title tag or meta description is not convincing users to click. In that case, you rewrite the title and description, not the content itself. Low impressions paired with a low average position, say, position 30 or higher, means your page hasn't earned enough authority to rank on the first page yet, so your focus should be on building links or improving the content depth.
Think of CTR as the bridge between visibility and traffic. A page ranking in position 6 with a 12% CTR often drives more clicks than a page in position 3 with a 2% CTR.
A quick diagnostic framework: check position first to confirm you're ranking, then check impressions to confirm Google is surfacing the page, then look at CTR to confirm users find the result worth clicking. Working through the metrics in this order saves you from optimizing the wrong element.
Step 4. Use queries and pages to find opportunities
The Queries and Pages tabs at the bottom of the google search console performance report are where the most actionable insights live. These two tabs let you move beyond site-level averages and drill into specific keywords and URLs to find exactly where you're leaving traffic on the table. Most users glance at them and move on. If you slow down here and sort by the right columns, you'll consistently find content worth fixing.
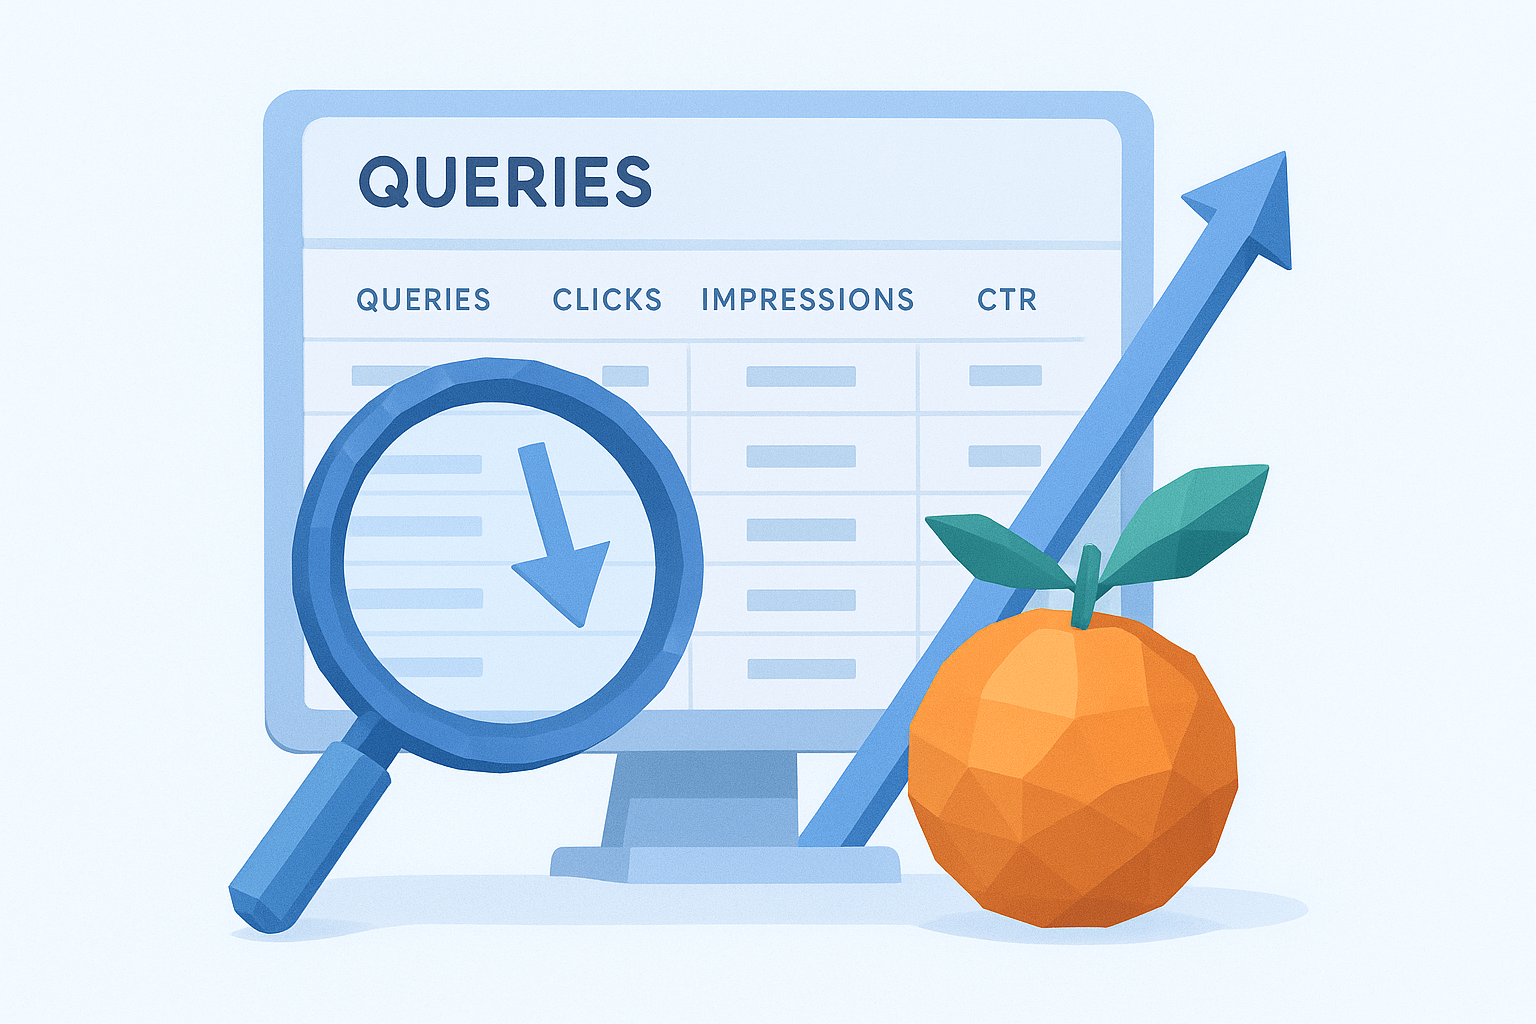
Find low-hanging fruit in the Queries tab
The Queries tab shows every search term that triggered an impression for your site, along with its click, impression, CTR, and position data. The fastest opportunity to find is a keyword where your page ranks between position 5 and 15 with a strong impression count but a below-average CTR. That combination tells you Google already trusts your page enough to show it near the top, but users aren't choosing it over competitors.
A query ranking in position 8 with 2,000 impressions and a 1% CTR is often easier to improve than trying to rank a brand-new page from scratch.
To find these opportunities systematically, follow this process:
- Click the Queries tab below the chart
- Click the "Position" column header to sort from lowest (best) to highest
- Scroll to queries where position sits between 5 and 20
- Check the CTR column, flag any query where CTR falls below 3% at those positions
- Click on a flagged query to filter the report and see which specific page is ranking for it
- Rewrite the title tag and meta description for that page to make it more compelling and specific
Identify underperforming pages and fix them
Switch to the Pages tab and sort by impressions in descending order. Your highest-impression pages with low CTR are your priority targets, not your lowest-traffic pages. These pages already have Google's attention, which means you only need to improve how the result looks in search to convert more visibility into actual clicks.
Pull the top 10 pages by impressions, note the CTR for each, and compare them against your site average CTR. Any page sitting more than two percentage points below your average deserves a title and description audit before you touch the content itself.
Step 5. Segment with filters and search appearance
The default view of the google search console performance report combines all your data into one aggregated snapshot. That's useful for a high-level check, but it hides the distinctions that matter most. Filters and the Search Appearance dimension let you isolate specific slices of your data so you can analyze mobile versus desktop, branded versus non-branded traffic, and rich result types separately rather than as one blended average.
Narrow your data with filters
Filters appear directly below the metric boxes at the top of the report. Click "+ New" to add one. You can filter by query, page, country, device, and search appearance. The combinations you'll use most often are:
- Query + Contains: Type a keyword to isolate all queries that include a specific term, useful for grouping content around a topic cluster
- Device: Split desktop and mobile data separately to check if a drop is device-specific
- Country: Isolate traffic from a single country when your audience is region-specific or when you're running geo-targeted content
To find non-branded traffic specifically, add a Query filter, select "Does not contain," and type your brand name. The resulting data shows only organic discovery traffic, which reflects how well your content performs for users who don't already know you exist. This is often the more meaningful number for evaluating SEO performance.
Stacking two filters at once, such as device type plus country, narrows your dataset quickly and surfaces performance differences you'd never spot in the default view.
Use Search Appearance to check rich result performance
The Search Appearance filter is one of the most overlooked options in the report. Click it to see how your content performs across different result formats: standard web results, video results, FAQ rich results, and more. Each format gets its own impression and CTR data, which tells you whether your structured markup is actually driving additional visibility.
For example, if you have FAQ schema on several pages but those pages show zero impressions under the FAQ appearance type, your markup is either malformed or not meeting Google's quality threshold. You can check your implementation against Google's Rich Results Test to confirm whether the markup is valid. Fixing broken schema on high-impression pages is a fast way to unlock additional search real estate without writing new content.
Step 6. Use regex, exports, and avoid common traps
The google search console performance report has two advanced capabilities that most users never touch: regex filtering and CSV exports. Beyond learning these features, you also need to know which common interpretation mistakes cause people to act on data that doesn't mean what they think it means. Skipping this step leads to content decisions built on faulty assumptions, so take the time to understand all three areas before you start optimizing.
Filter with regex to find grouped queries
Regex filtering lets you write a pattern that matches multiple queries at once instead of filtering one keyword at a time. To use it, click "+ New" under the filter bar, select "Query," then choose "Matches regex" from the dropdown. For example, entering how to|what is|why does matches every query in your data that contains any of those phrases, which lets you isolate all informational intent traffic in one view.
Regex filtering is particularly useful when you want to separate branded queries from non-branded ones without manually excluding each brand variation.
Here are a few regex patterns you can use directly in the filter field:
^best- matches all queries that start with the word "best"\d+- matches queries that contain any number, useful for isolating year-based searches(how|what|why|when)- captures all question-based queries across your site
Export data for deeper analysis
The built-in report view caps the rows it displays and limits how deeply you can slice the data. Exporting to a spreadsheet removes those limitations and lets you build pivot tables, apply custom sorting, and cross-reference query data against your actual page content. Click the export button in the top right corner of the report and choose either CSV or Google Sheets.
Once you have the data in a spreadsheet, sort by impressions descending and add a calculated CTR benchmark column using =clicks/impressions. Flag any row where CTR falls more than 50% below your site average and queue those pages for title tag updates first.
Avoid the most common interpretation mistakes
Two mistakes show up repeatedly when people read this report. First, average position is a mean across all queries, so a page ranking in position 2 for one keyword and position 40 for another shows an average of position 21, which looks worse than the page actually performs for its primary term. Always click into individual queries rather than relying on page-level position averages alone.
Second, impressions do not equal reach. A single search session can generate multiple impressions for the same page if a user refines their query. Treat impression counts as directional signals rather than precise audience size measurements.
Quick recap
The google search console performance report gives you everything you need to understand how your site performs in search, but only if you use it correctly. You now know how to open the right property, set meaningful date ranges, compare periods after content updates, and read clicks, impressions, CTR, and position as a connected system rather than isolated numbers.
From there, the Queries and Pages tabs point you toward real optimization targets: pages with high impressions but low CTR, and queries ranking just outside the top five that need a better title tag, not new content. Filters, regex patterns, and exports push your analysis further without requiring any paid tools.
Turning these insights into content at scale is where AI Flow Chat makes the biggest difference. Feed your top-performing queries and pages directly into your workflows to reverse-engineer what works and produce more of it, faster and with less guesswork.
Continue Reading
Discover more insights and updates from our articles
Writing SEO content without a clear brief is like building a house without blueprints, you'll waste time, miss key details, and end up reworking most of it. A good content brief generator takes the gu...
Every manual task inside your CRM, updating a lead status, sending a follow-up email, assigning a case to the right rep, costs time you could spend on work that actually moves revenue. Salesforce work...
Most people use "content strategy" and "content marketing strategy" interchangeably. They're not the same thing. The difference between them isn't just semantics, it affects how yo...