Social Blade YouTube Analytics: Metrics, Growth, And More
At AI Flow Chat

Contents
0%Every YouTube creator and marketer eventually hits the same question: how do I know if a channel, mine or a competitor's, is actually growing? Social Blade YouTube analytics gives you a free, public window into the numbers that matter: subscriber trends, estimated earnings, video upload frequency, and projected growth. It's one of the most widely used third-party tools for benchmarking YouTube performance without needing access to someone else's dashboard.
But raw numbers only tell half the story. Knowing that a competitor gained 50,000 subscribers last month is useful. Understanding why they grew, what hooks they used, which content formats performed, what patterns drove engagement, is where the real advantage sits. That's exactly the gap AI Flow Chat fills. Our platform lets you pull in YouTube videos, competitor content, and reference materials directly onto a visual AI canvas, then use multi-model AI to break down what's working and replicate those patterns in your own voice.
This article covers what Social Blade tracks, how to read its YouTube metrics, where the data comes from, and how to pair that intelligence with actual content creation. Whether you're auditing your own channel or sizing up the competition, you'll walk away knowing how to turn Social Blade's numbers into something actionable.
What Social Blade shows for YouTube channels
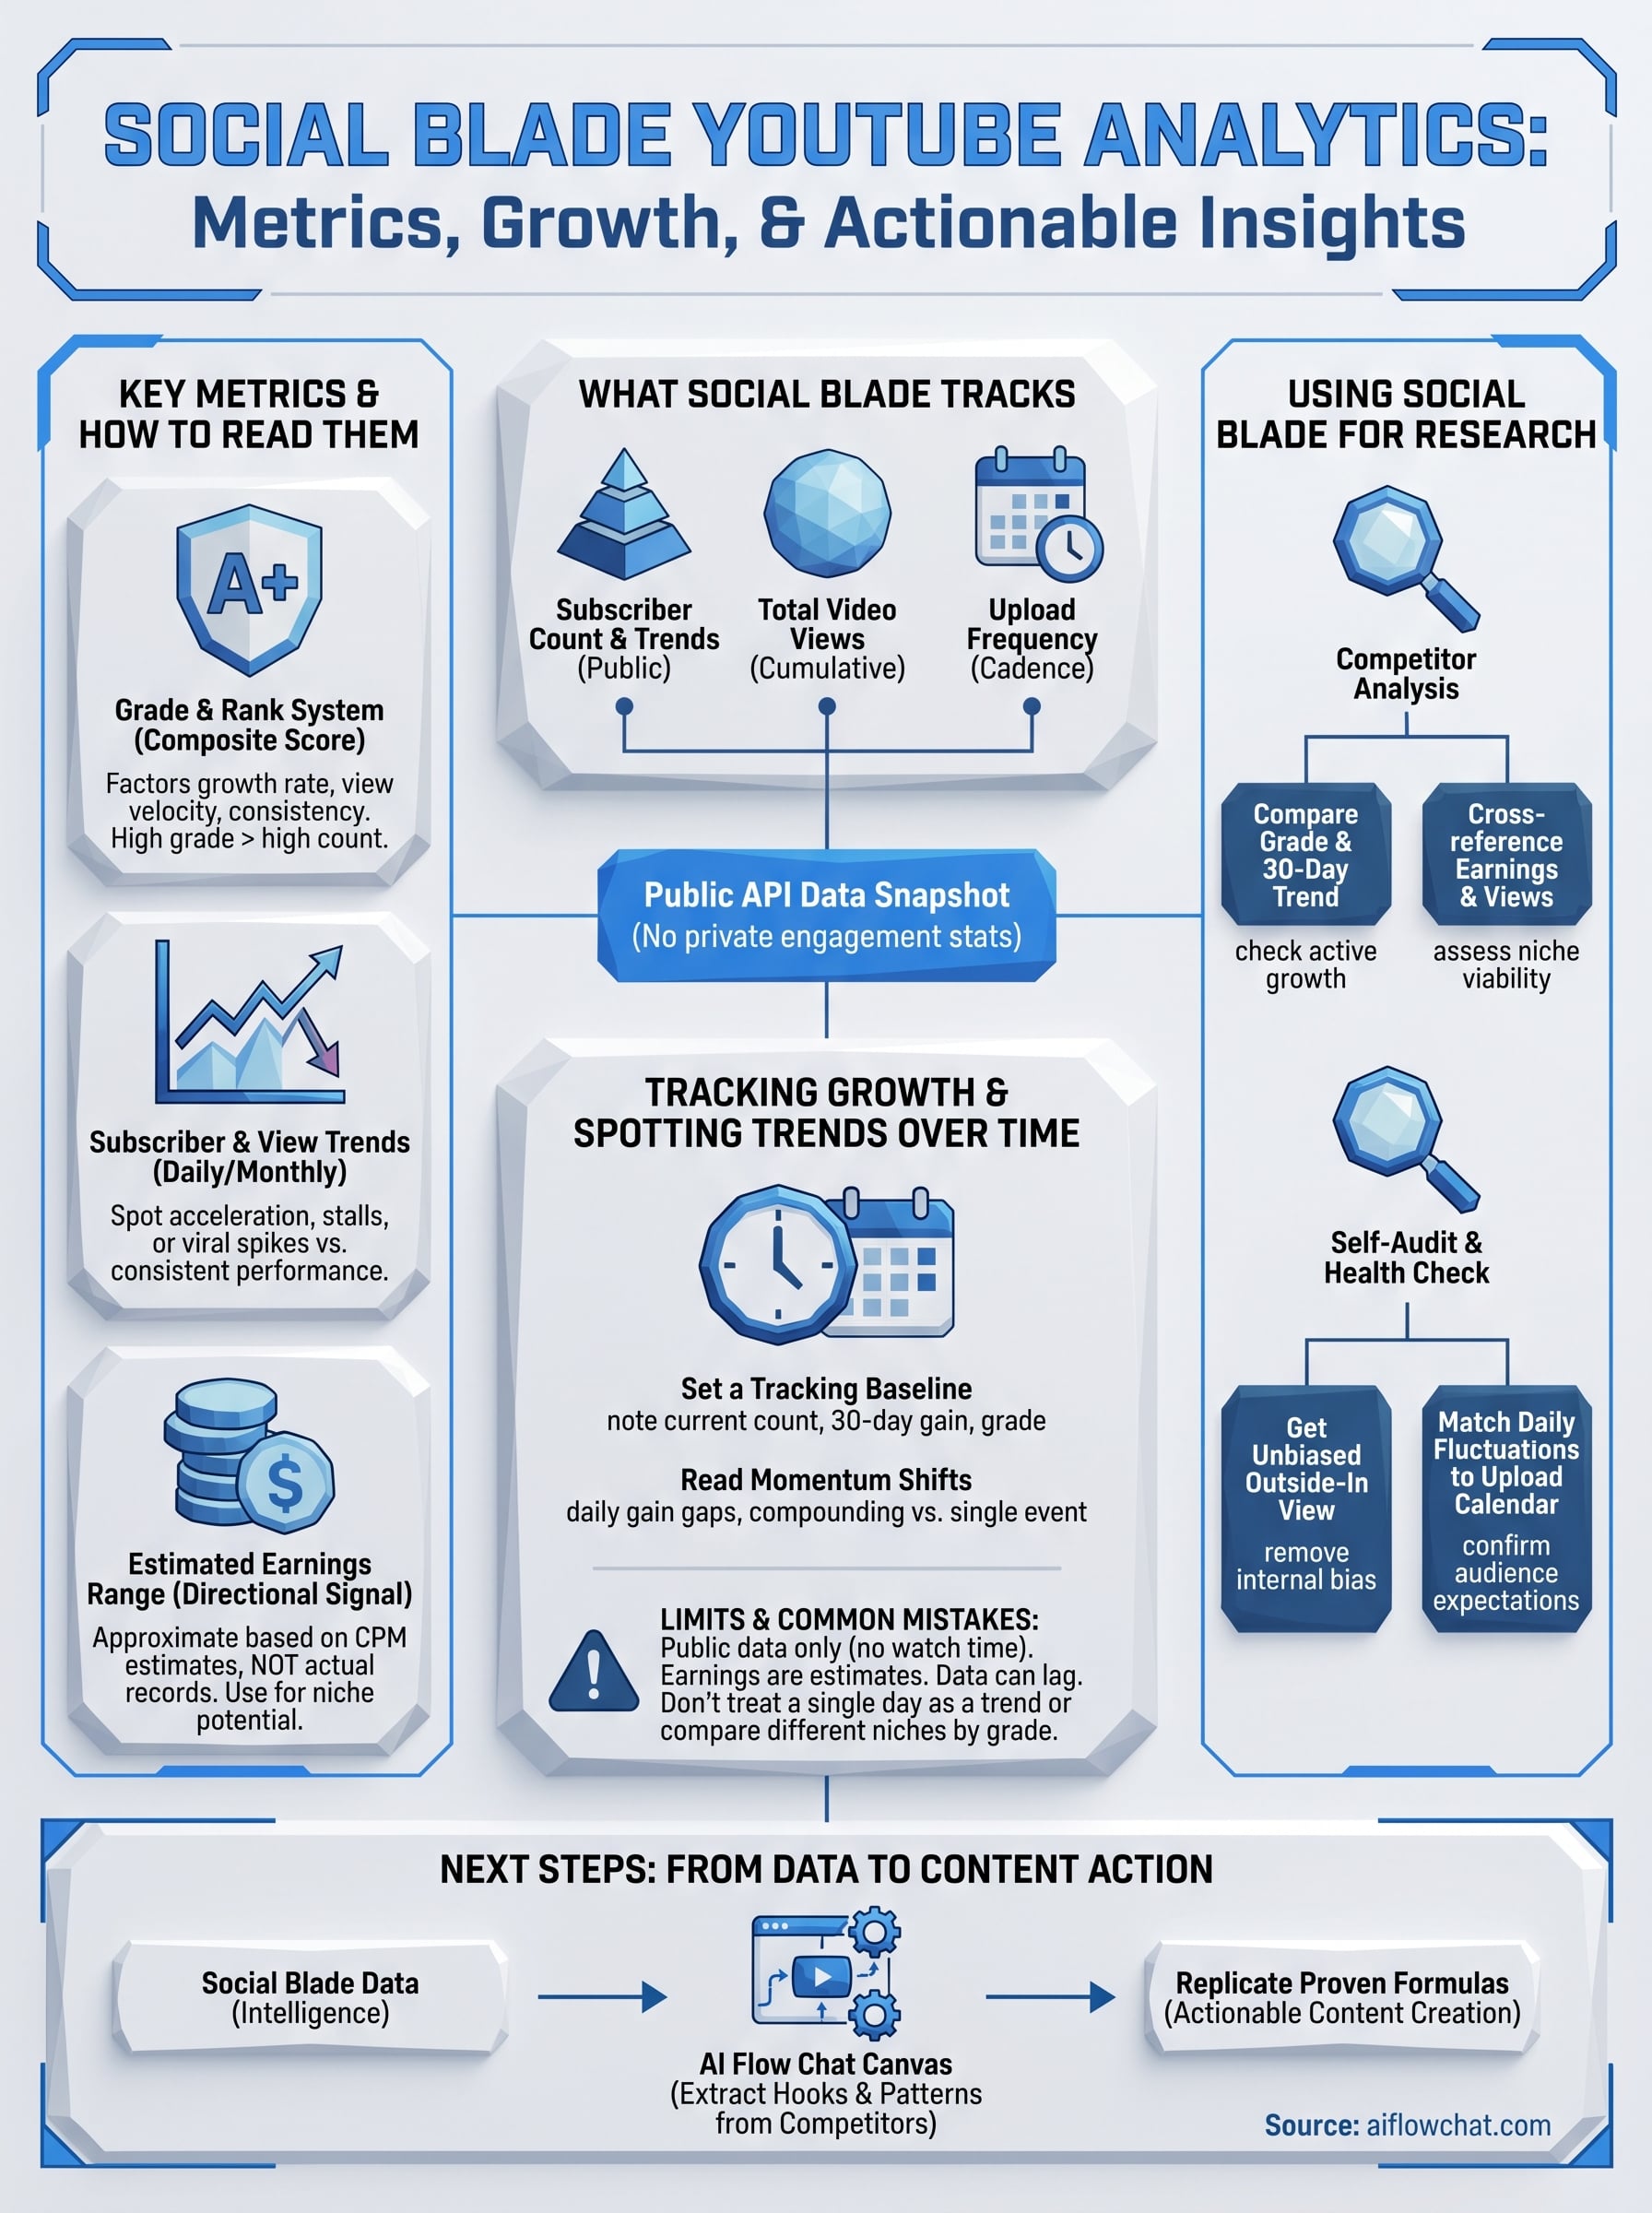
When you search any public YouTube channel on Social Blade, you get a snapshot of performance data pulled directly from YouTube's API. Social Blade YouTube analytics aggregates that data into a single page so you can see a channel's subscriber count, total video views, and upload frequency at a glance, without logging into YouTube's native creator tools or asking the channel owner for access.
Channel overview and subscriber data
The first thing you see on a channel's Social Blade page is the overview panel. This section shows the current subscriber count, total lifetime views, and an estimated global rank compared to every other YouTube channel tracked in the database. Social Blade also assigns a letter grade from A++ down to F, based on a scoring algorithm that weighs subscriber growth rate, view velocity, and upload consistency.

Below the grade sits a daily subscriber gain and loss tracker that updates on a rolling basis. This turns a static follower count into something far more useful: a trend line. If a channel gained 15,000 subscribers one day and then lost 3,000 the next, that movement is logged, and you can trace it back to specific dates to start building a theory around what drove the spike or the drop.
Video and upload history
Social Blade also records upload history and average publishing frequency, giving you a scrollable log of when a channel posted content over time. You can look back weeks or months to see whether a creator has been consistent or whether there were long publishing gaps.
A gap in uploads followed by a sharp subscriber decline is one of the clearest signals that a channel's growth depends heavily on posting cadence.
Upload frequency and subscriber momentum tend to track together, and Social Blade makes that pattern visible without needing any data exports or manual tracking on your end.
Estimated earnings range
One of the most searched features on Social Blade is the estimated monthly and yearly earnings range. Social Blade calculates these figures using estimated CPM rates against total view counts, and it always presents a low and high estimate rather than a single figure. These numbers are approximations based on public signals, not actual payment records, so treat them as directional indicators rather than precise figures.
Even so, the earnings range is useful when you're evaluating whether a niche is commercially attractive for a new channel or content pivot. If a competitor in your space shows a monthly high estimate of $35,000, that signals advertisers are actively spending in that category, which matters when you're deciding where to invest your content production time.
Key Social Blade metrics and how to read them
When you open a channel's Social Blade YouTube analytics page, you're looking at several distinct data layers. Each metric serves a different purpose, and reading them together gives you a clearer picture than any single number on its own.
The grade and rank system
Social Blade assigns every channel a letter grade from A++ to F based on a composite score that factors in subscriber growth rate, view velocity, and upload consistency. A high grade signals a channel actively growing across all three areas, while a low grade can flag stagnation even when the raw subscriber count looks impressive. Below the grade, you'll see a global rank that places the channel against every other YouTube channel in the database, which makes cross-niche benchmarking straightforward.
A channel with 500,000 subscribers and a C grade is often outperformed in growth rate by a newer channel with 50,000 subscribers and an A grade.
Subscriber and view trend data
The most actionable numbers on the page are the daily and monthly subscriber change figures, which show net gains and losses over specific time windows. You can scroll through historical data to spot the exact dates when a channel accelerated or stalled. Pairing that with the total video view count and average views per upload gives you a ratio that reveals whether subscribers are actually watching or just sitting dormant on the follower list.
Reading these growth patterns together tells you whether a channel earns its subscribers through consistent content performance or whether it benefited from a single viral moment that has not repeated. Both patterns show up clearly once you know which numbers to cross-reference.
How to use Social Blade for channel research
Using Social Blade YouTube analytics for research starts with knowing what question you're trying to answer. Are you sizing up a competitor before entering a niche, or auditing your own channel's health? Each use case calls for a slightly different approach, but the platform's structure makes both straightforward once you know where to look.
Researching competitor channels
When you're analyzing a competitor, start by searching their channel name on Social Blade and reviewing the grade, global rank, and 30-day subscriber change together. These three data points tell you whether the channel is actively growing or riding past momentum. From there, look at the upload history to identify posting frequency and timing patterns that correlate with their highest growth periods.
A competitor's sharpest subscriber spikes almost always line up with a specific content format or publishing push, and Social Blade's date-stamped data makes that pattern visible.
Cross-reference their estimated monthly earnings range against their total view count to get a sense of how effectively they monetize their audience. A high view count paired with a low earnings estimate often signals a young demographic or non-commercial niche, both worth knowing before you commit to a content direction.
Auditing your own channel
Pulling up your own channel on Social Blade gives you an outside-in perspective that YouTube Studio's internal analytics don't offer. You can see your grade and global rank without the bias of being inside your own dashboard, which makes it easier to spot weaknesses you might otherwise rationalize away.
Look specifically at your daily subscriber fluctuations over the past 30 days and compare them against your upload calendar. If subscriber gains drop sharply on days you skip posting, that pattern confirms your audience expects consistent content, and that makes publishing cadence a production priority worth acting on immediately.
How to track growth and spot trends over time
Tracking growth on Social Blade YouTube analytics works best when you treat it as a habit rather than a one-time lookup. Checking a channel's numbers on a single day gives you a snapshot. Returning to that same channel weekly builds a pattern, and patterns are where the real insights live. Set a regular cadence, whether weekly or biweekly, and record what you see so you can compare periods rather than individual data points.
Setting a tracking baseline
Before you can spot meaningful movement, you need a starting reference point. On your first visit to a channel's Social Blade page, note the current subscriber count, the 30-day net gain, and the letter grade. These three numbers together form your baseline. From there, any week-over-week shift in the grade or a sudden acceleration in net daily gains signals that something changed in the channel's publishing strategy or content mix.
If a channel's grade drops two levels within a month despite a rising subscriber count, the channel is likely growing from a single viral video rather than from consistent output.
Reading momentum shifts
Momentum shifts show up in the daily subscriber change column before they show up anywhere else. A channel that posts consistently and maintains steady daily gains has compounding momentum. A channel that spikes sharply and then flatlines is riding a single event. Look at the gap between a channel's peak daily gain and its average daily gain to measure how dependent the growth is on outlier content. A tight gap means reliable, repeatable growth. A wide gap means the channel has not figured out how to replicate what worked. Knowing which pattern you're dealing with changes how you respond to the data entirely.

Limits of Social Blade data and common mistakes
Social Blade YouTube analytics pulls from YouTube's public API, which means the platform can only show what YouTube makes publicly available. Subscriber counts, view totals, and upload dates are all accessible through that API, but engagement data like watch time, click-through rates, and audience demographics are never exposed. If you rely on Social Blade as a complete picture of channel health, you will miss the metrics that often explain why a channel performs the way it does.
Data accuracy and estimation gaps
Social Blade's earnings estimates are the most commonly misread numbers on the platform. The platform calculates these figures using an assumed CPM range against view counts, but actual CPM varies significantly based on audience geography, niche, and ad format. A channel in the personal finance niche will typically earn several times more per thousand views than a gaming channel with the same view count, yet both might show similar earnings ranges on Social Blade.
Treat Social Blade earnings figures as a rough directional signal, not a benchmark you quote to clients or use to make budget decisions.
Subscriber count updates can also lag by 24 to 48 hours, which means a channel that just went viral may look flat on Social Blade while it's actively gaining thousands of followers in real time.
Mistakes to avoid when reading the numbers
The most common mistake is treating a single day's data as a trend. One strong day in subscriber gains means nothing without the surrounding context of what the channel typically earns per day. Another frequent error is comparing channels across completely different content niches using the letter grade alone, since the grade algorithm does not account for niche difficulty or audience size differences. Both mistakes lead to conclusions that look data-driven but are built on incomplete comparisons.
Next steps
Social Blade YouTube analytics gives you a reliable starting point for understanding channel performance, but the data stops at the numbers. You now know how to read subscriber trends, interpret grade signals, spot momentum shifts, and avoid the most common misreading errors. The next move is turning that competitive intelligence into actual content that performs in your niche.
That's where the process breaks down for most creators. Knowing a competitor gained 80,000 subscribers in a month is useful. Building content that replicates what drove that growth is a completely different task, and it requires more than a spreadsheet. AI Flow Chat lets you paste competitor video links directly into a visual AI canvas, extract the hooks and patterns that drove engagement, and generate content in your own voice using those same proven formulas. You stop guessing and start working from what already works. Start building content workflows that act on what you find rather than just watching the numbers move.
Continue Reading
Discover more insights and updates from our articles
Writing SEO content without a clear brief is like building a house without blueprints, you'll waste time, miss key details, and end up reworking most of it. A good content brief generator takes the gu...
Every manual task inside your CRM, updating a lead status, sending a follow-up email, assigning a case to the right rep, costs time you could spend on work that actually moves revenue. Salesforce work...
Most people use "content strategy" and "content marketing strategy" interchangeably. They're not the same thing. The difference between them isn't just semantics, it affects how yo...